
Scripting & APIs
-
Is There Music In Your Data?
There might be music in your data! In this video, we explore how to use Dundas BI to convert data into music.
-
How To Embed Dundas BI In A Third-Party Web Page
Embedded Business Intelligence is the integration of reports, dashboards, and even self-service content inside an application. Learn how to embed Dundas BI in a third-party web page.
-
Enhance Your BI User Experience Using Custom Menu Navigation Controls

Learn why you should build a custom navigation experience in your business intelligence solution and how the new Menu Control in Dundas BI will help increase user adoption.
-
How to Leverage Facebook Data for Advanced Analysis in Dundas BI

Dundas BI is able to interact with social networking platforms like Facebook. Let's use Python to fetch data from your corporate Facebook page and then create a sleek dashboard using it.
-
How to Create a Fantasy Football Dashboard in 3 Easy Steps
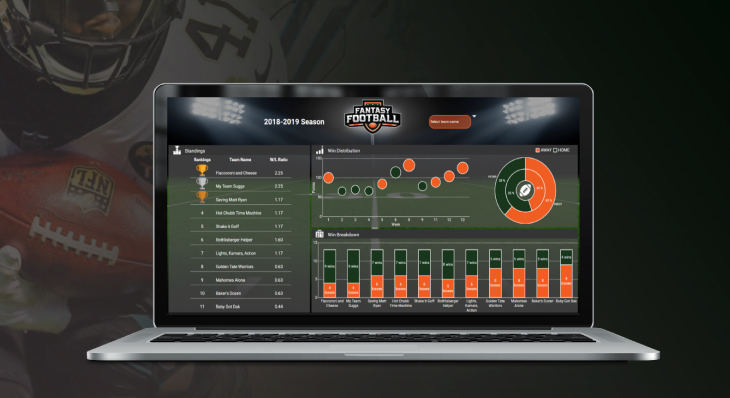
Rejoice! It's football season. Learn how to create a fantasy football dashboard with data from YOUR OWN fantasy league!
-
Leverage the REST API in Dundas BI for External Administration
In this video, we explore how you can identify and use a REST API inside Dundas BI to perform application functions without stepping foot in the application
-
Questions to Ask When Evaluating the Flexibility of a BI Tool
If you’re evaluating a BI tool, you need to make sure that the tool you choose will be able to grow and expand as your requirements grow and expand. Flexibility is paramount to meeting your needs
-
How to Create Custom Tokens in Dundas BI
Users no longer have to wait until the end of the month (quarter, year, etc.) to crunch numbers and pull reports. This video explores custom tokens in Dundas BI and how users can build their own.
-
9 Key Criteria for Choosing an Embedded Analytics Application

Do you have your own web-based application and are looking to add business intelligence (BI) capabilities to it? If so, there are a lot of technical points you need to keep in mind.
-
Adding Weather Data to Dundas BI is a Breeze

The possibilities when working with weather data are near endless. Let's explore how we can incorporate and visualize weather data in dashboards in Dundas BI
-
Adding Weather Data to Dundas BI is a Breeze - Part 2
Watch as we use weather data to build a control that can be placed on any dashboard.
-
Adding Weather Data to Dundas BI is a Breeze - PART 1
Do you need to pull in web-based data into your BI system? In this video, we’ll start by showing you how you can get any web-based data (such as weather data) into a BI system like Dundas BI
-
Use JavaScript to Create a Custom Business Intelligence Navigation Experience

BI success depends on its adoption by end-users. This is why it's crucial you provide them with options to navigate to the content they want in a way they're comfortable with. Enter, JavaScript.
-
Build It, Dream It: Raffle Dashboard
Dundas BI is the most flexible business intelligence platform in the world. And that’s not us being hyperbolic. With Dundas BI, the only limit to how much you can customize it is your imagination.
-
Extend your Data with DundasScript
In this video, we take a real-life Marketing sample and show how DundasScript can be used to apply a few calculations to extend the dashboard to discover deeper insights.
-
Use Tokens to make your Dashboards Smart
Explore the vast customization of Tokens in Dundas BI, along with some advanced customization and scripting options.
-
Go Beyond Simple Customization
Let's take a look at some advanced customization, and how you can take your dashboards even further.
-
Innovation Never Rests: Delivery API
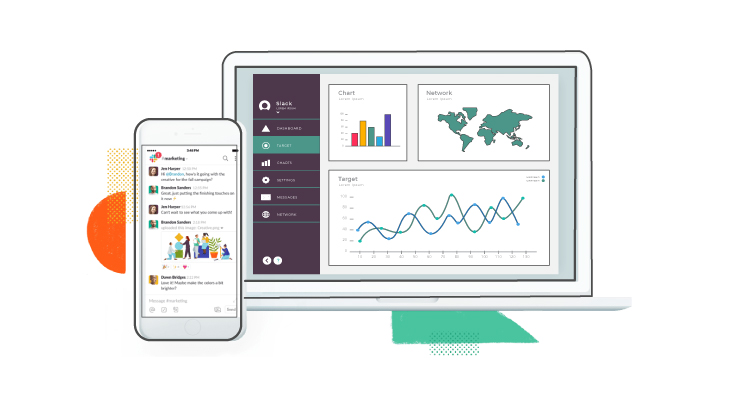
The Export Delivery API allows users to export and deliver Dundas BI exports through notifications, creating a more collaborative business intelligence experience.
-
How to Build your Custom UI using the Dundas BI APIs

One great aspect of Dundas BI’s user interface flexibility is its full exposure to the underlying APIs that enable customization of any aspect of the application. Let's dive into one such use case.
-
Using Animations to Enhance your Dashboard's Readability
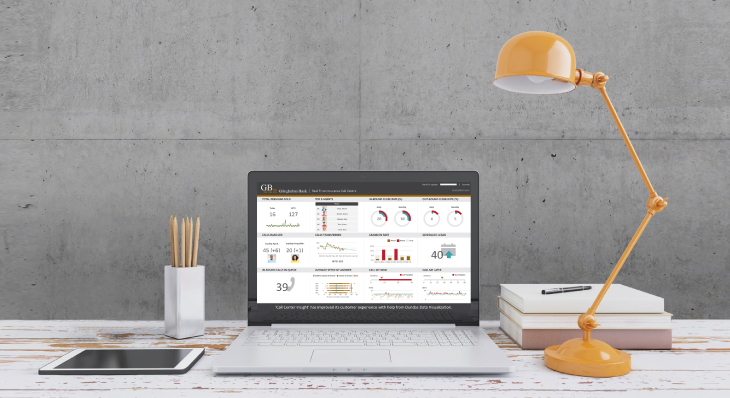
Dashboards are a great way to visually represent your data to track, analyze and display KPIs at-a-glance. One of the ways to enhance the readability of a dashboard is by making use of animations.