Pivot
The Pivot transform allows you to create new columns out of rows in your input that contain a corresponding set of values (opposite of Unpivot).
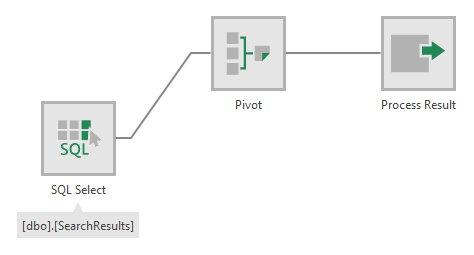
1. Input
The Pivot transform requires one input transform that has at least three columns.
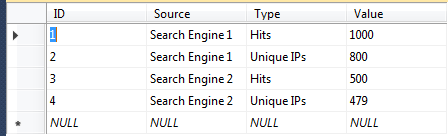
For example, the input could be a SQL Select transform that corresponds to the following table:
2. Configure
In the Pivot configuration dialog, you need to configure the following settings:
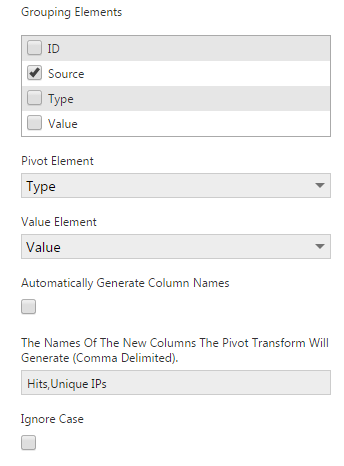
Check the Grouping Elements that can be used to group a set of rows together (e.g., the Source column in our example), which will be turned into a single record containing a value for each new column. The selected column(s) will be part of the output as well.
Set Pivot Element to the names in the rows that will correspond with the names of the new columns (e.g., the Type column in our example).
The Value Element should be set to the values that will be moved from separate rows into the values of the new columns (e.g., the Value column in our example).
To automatically generate the new column names from your data, select Automatically Generate Column Names, and the field below will be automatically filled in with names after you close the dialog.
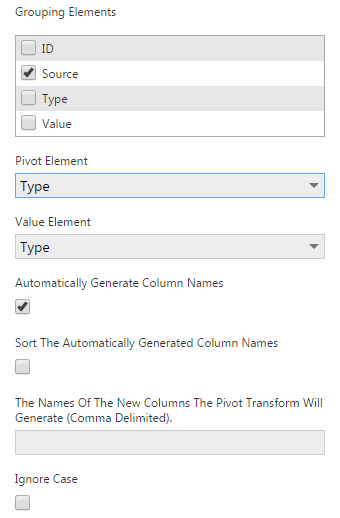
When automatically generating column names, select Sort The Automatically Generated Column Names before submitting the dialog if you want the new columns to be sorted alphabetically.
If you prefer to enter the names of the new columns yourself, they must match the values of the Pivot Element in your data (e.g., Hits,Unique IPs in our example).
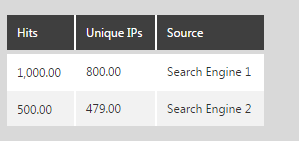
3. Output
The output of the Pivot transform consists of:
- A single row for each Grouping Elements value or value combination.
- New columns that correspond to the values of the Pivot Element column.
- The values for the new columns that came from the Value Element column.
The figure below illustrates the output from the Pivot transform as applied to our example input data.