Histogram
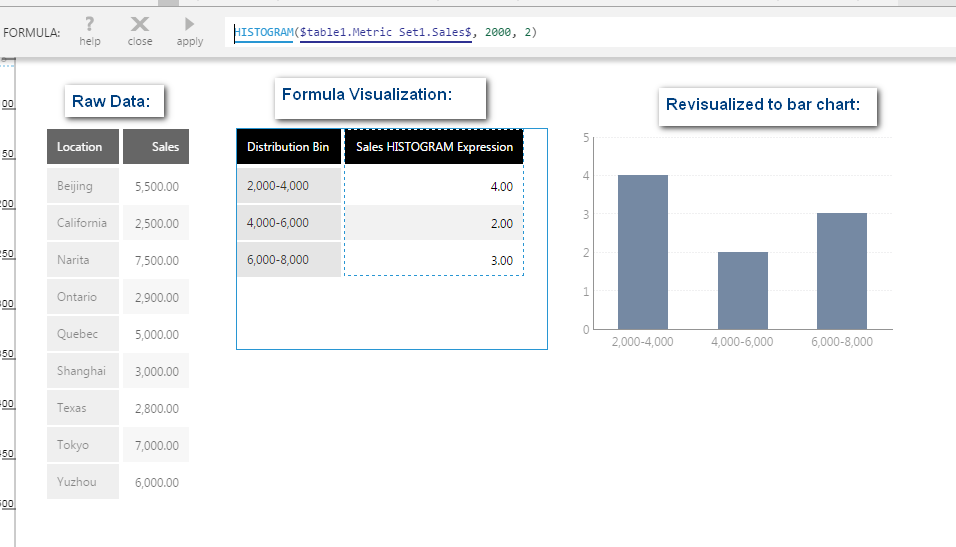
The Histogram function assigns numeric values to bins and returns the counts. This analyzes the numeric values by themselves, and can make it possible to visualize how a set of numeric values are distributed, see which are the most or least common, and look for patterns.
Tip
You can also re-visualize Calculate Histogram to quickly generate a histogram chart. See Calculate Histogram.
Note
The histogram functions can only be used in a formula visualization.
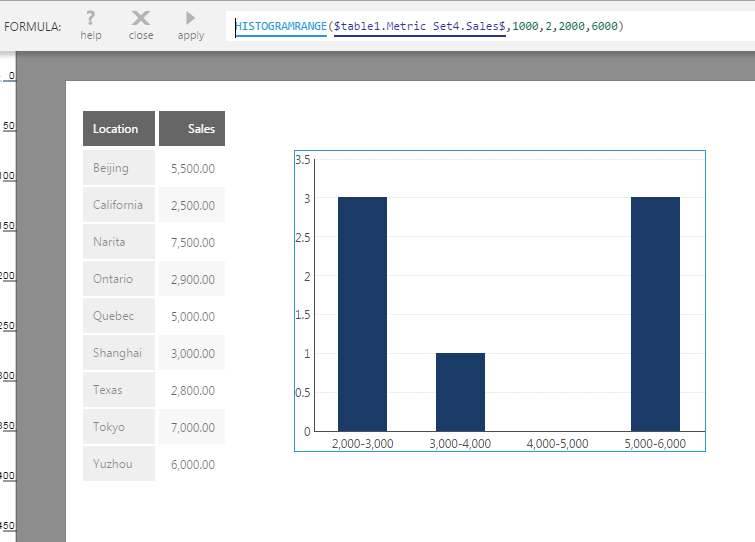
The Histogram Range function can optionally be used instead when you want to specify the start and/or end of the range of values included in the result.
1. Syntax
Histogram:
HISTOGRAM(d0,s0,s1,Alignments...)
Histogram Range:
HISTOGRAMRANGE(d0,s0,s1,s2,s3,Alignments...)
2. Input
The Histogram function requires the following input:
- d0 - The set of data values for which the histogram is calculated.
3. Parameters
The Histogram functions use the following parameters:
- s0 - The size of the bins for the numeric values to be assigned to, optional. Enter 0 or null to calculate the bin size automatically.
- s1 - A number representing the type of captions to describe the ranges, optional.
- 0: The default value is 0 (Auto)
- 1: ">=0 & <10, >=10 & <20"
- 2: "0-10, 10-20"
- s2 - (For Histogram Range) The value used to start the range of the first bin. Input values smaller than this will not be counted in the result.
- s3 - (For Histogram Range) The value used to end the range of the last bin. Input values greater or equal to this will not be counted in the result.
- Alignments... (One or More, Optional): Hierarchy placeholders to be used as the alignment axis, for grouping histogram results by the specified values rather than producing a single result.
4. Output
The histogram functions generate the following output:
- Histogram - The Histogram result set, containing only a Distribution Bin hierarchy and a count of the number of measure values from the input data within each bin.


