The Power of Dashboards on Wall-Mounted Displays
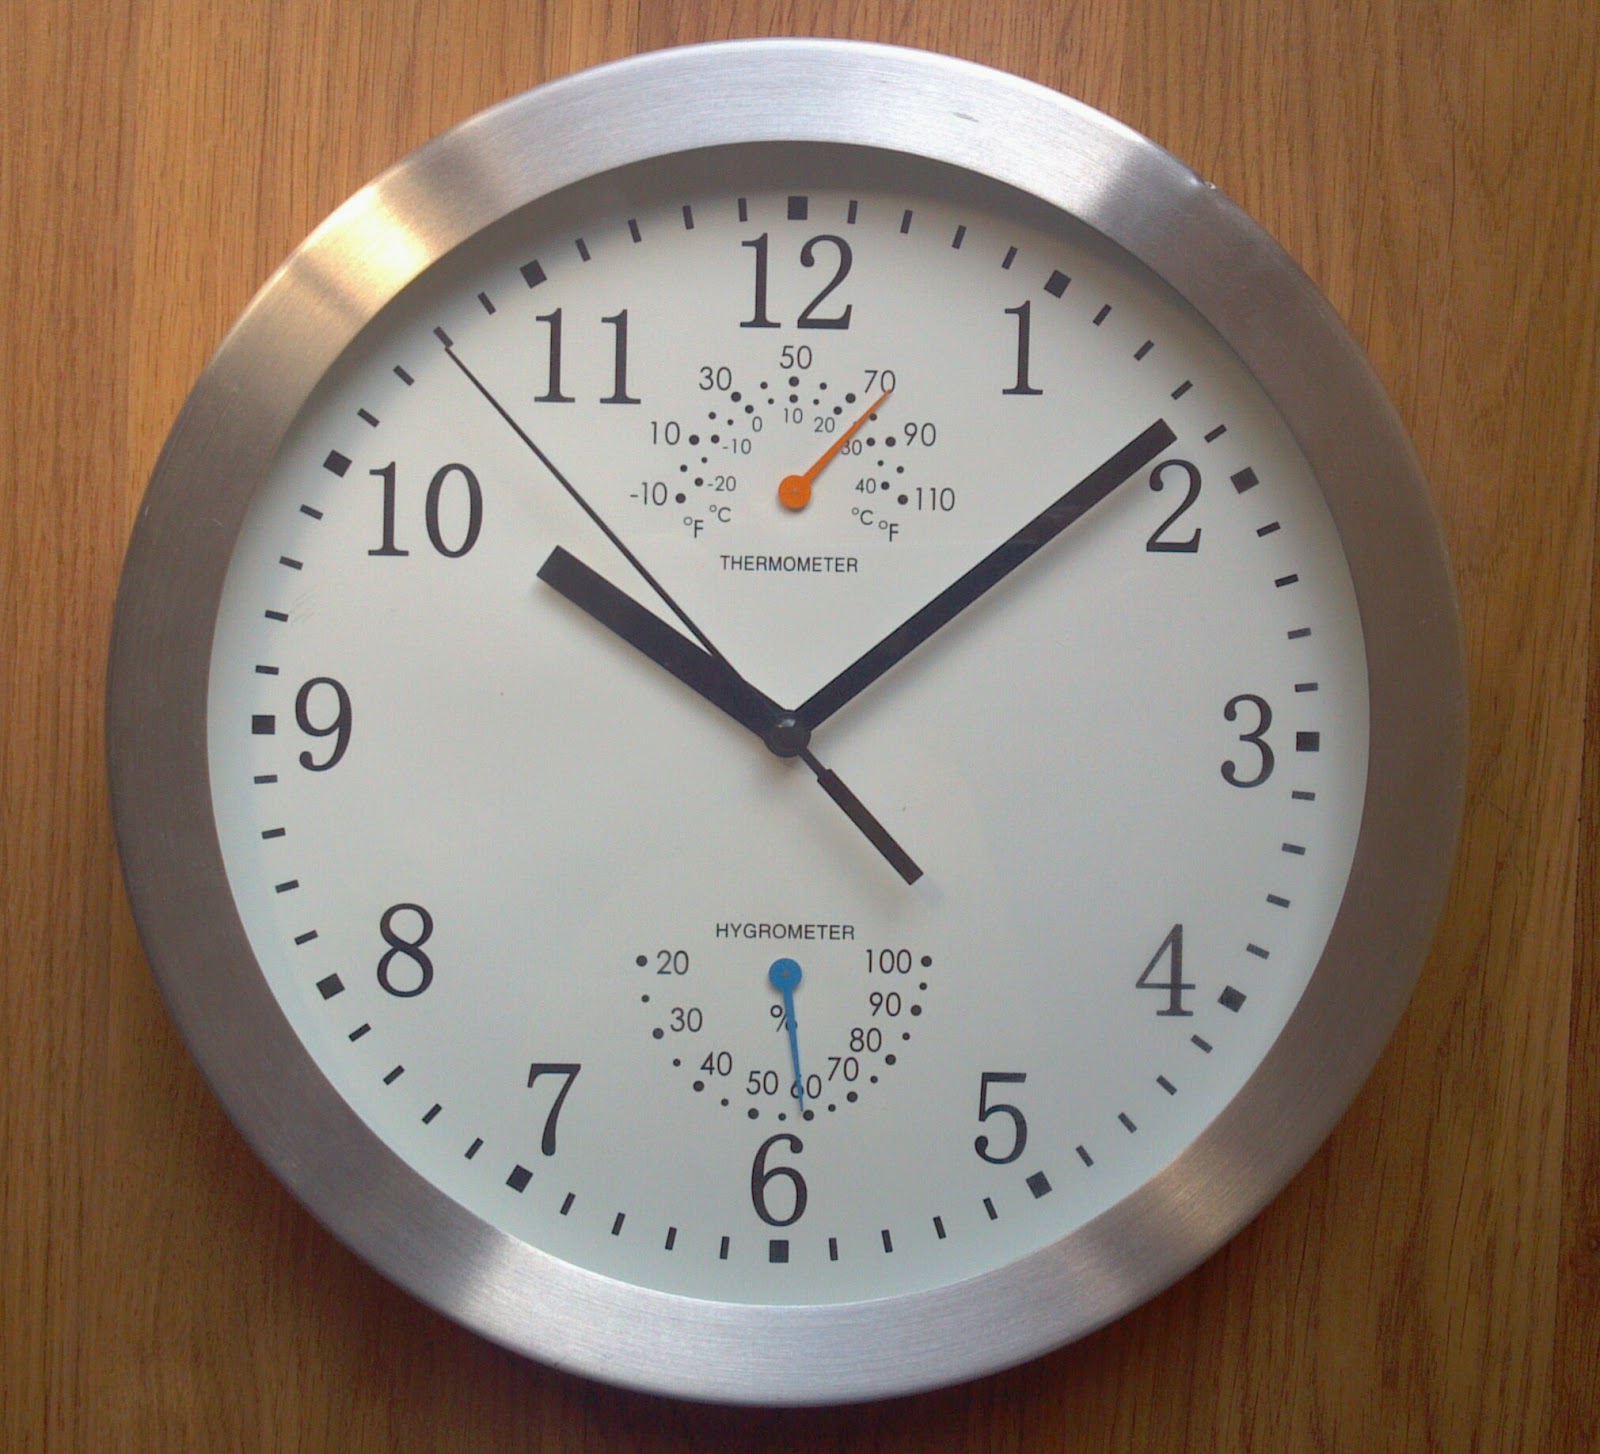
 There’s a reason we display things like clocks and calendars on walls; they need to be visible in order to be properly used.
The same goes for dashboards.
 There’s a reason we display things like clocks and calendars on walls; they need to be visible in order to be properly used.
The same goes for dashboards.

Sparklines, bullet graphs, linear gauges, and more. What are they, and how can they help your dashboard?

We forget important things all the time; our keys, birthdays, dinners, that left shoe... More importantly though, we forget important goals and priorities in our jobs. So, how can we fix this?
 “A dashboard is a visual display of the most important information needed to achieve one or more objectives, presented in such a manner that it can be monitored and interpreted at a glance”
– Troy Marchand, Dundas CEO
 A new study shows it's dashboards
Dundas Data Visualization, Inc.
400-15 Gervais Drive
Toronto, ON, Canada
M3C 1Y8
North America: 1.800.463.1492
International: 1.416.467.5100