Visualizing for the Color Blind

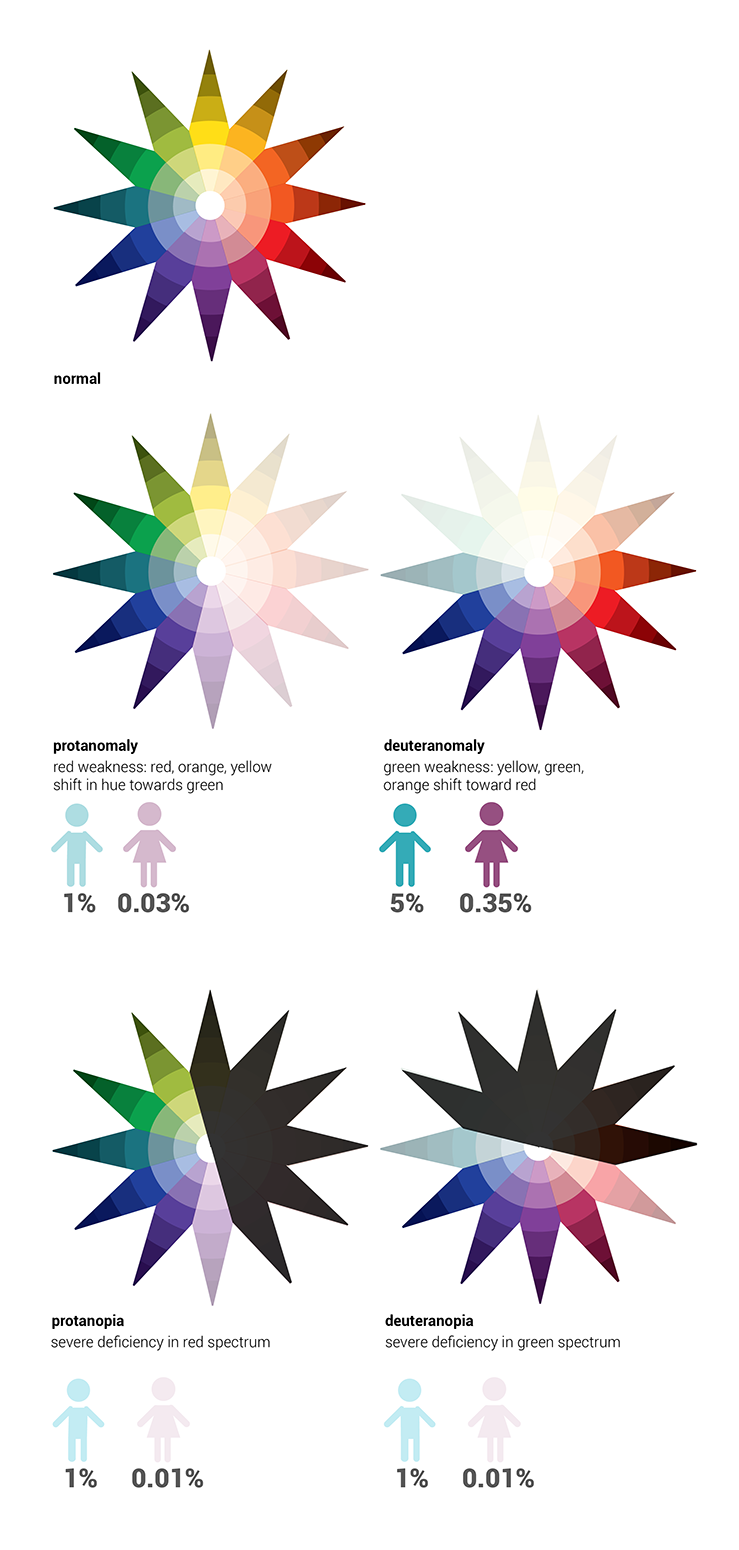
When designing data visualizations and dashboards, it’s important to keep this group of people in mind to make sure they are seeing the same results as everyone else.

When designing data visualizations and dashboards, it’s important to keep this group of people in mind to make sure they are seeing the same results as everyone else.

Ensure you are using the proper measure when creating you data visualization, it makes all the difference.

Discussing a great visualization of the New York City stop and frisk program.

Information learned from the 8th Annual IQPC Call Center Summit
 To maintain standards of quality, relevance, and integrity for evidence, consumers of presentations should insist that presenters be held intellectually and ethically responsible for what they show and tell.
Dundas Data Visualization, Inc.
400-15 Gervais Drive
Toronto, ON, Canada
M3C 1Y8
North America: 1.800.463.1492
International: 1.416.467.5100