Aligning data point labels inside bars
1. Overview
Learn how to align chart data point labels inside bars towards the start or the ends of the bars.
2. Displaying labels inside bars
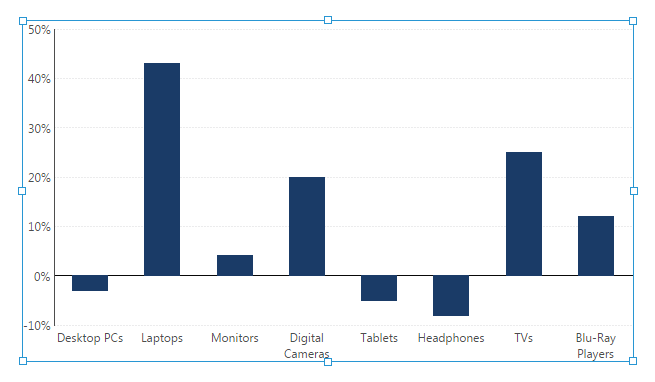
Consider the following bar chart which displays vertical bars.
Click the data points in the chart directly to select their series so that an outline appears around it, then go to Properties and click Font & Text (or the Text tab) to see the text-related properties of the series.
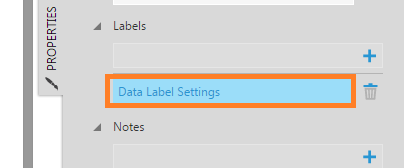
Click the + button next to Data Point Labels.
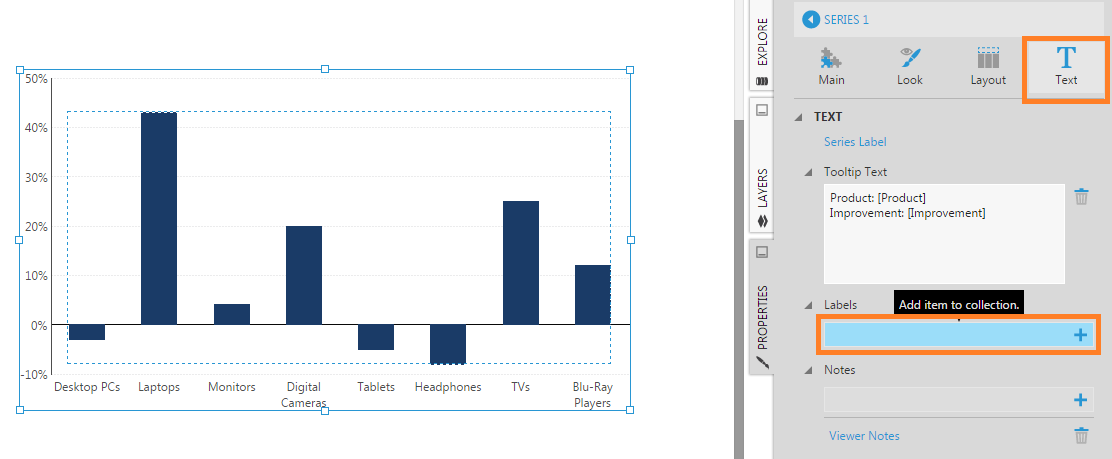
A Data Label Settings item is added. Click this to edit its properties.
In the Data Label Settings, set the Placement to Inside and enter the name of the measure in square brackets in the Text property. This is a placeholder which will be replaced with the actual measure value at each data point.

Measure values are now displayed within each bar.
3. Inside alignment toward start
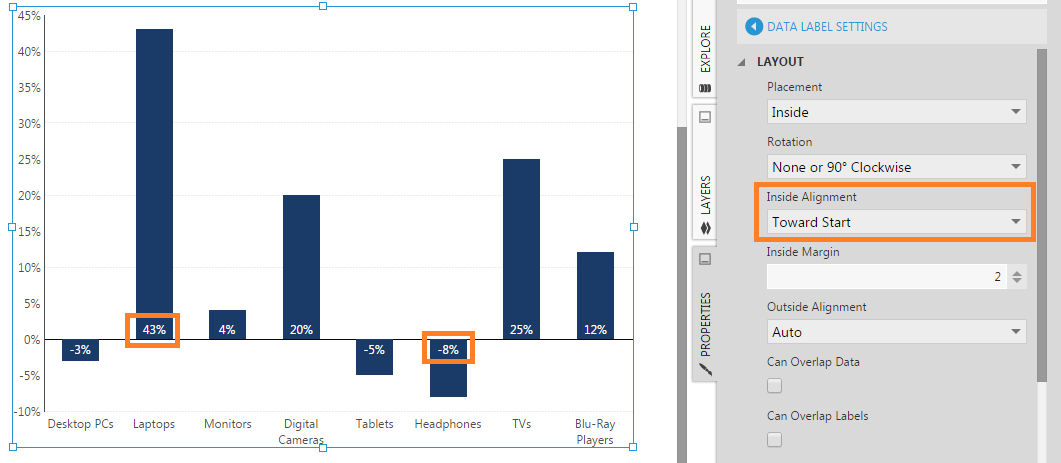
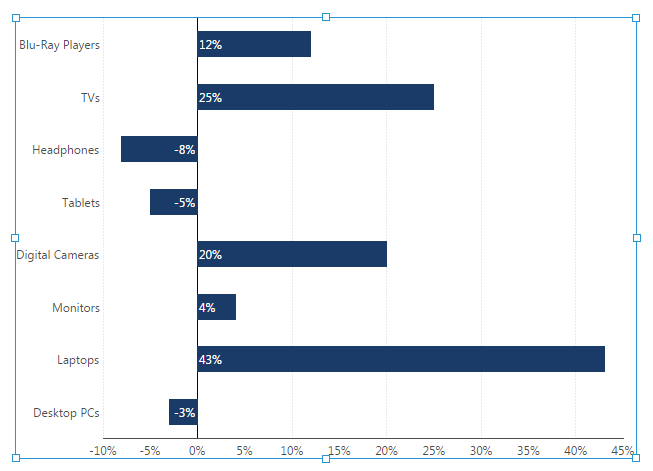
Data point labels displayed within the bars of a chart can be aligned towards the start of each bar (e.g. towards the zero or minimum value). This applies to bar, area, and range charts, including stacked and curved types.
In the Data Label Settings properties, set the Inside Alignment to Toward Start.
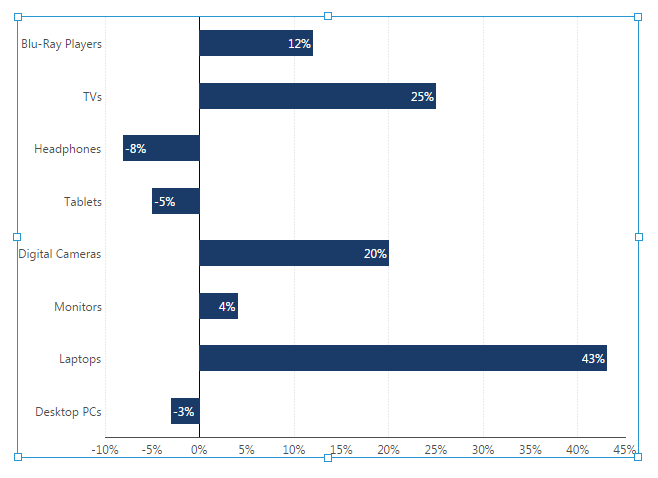
This will also work when the bars are horizontal (i.e. inverted axes). Go to the dashboard designer toolbar and click Horizontal Bars to see this.
4. Inside alignment toward end
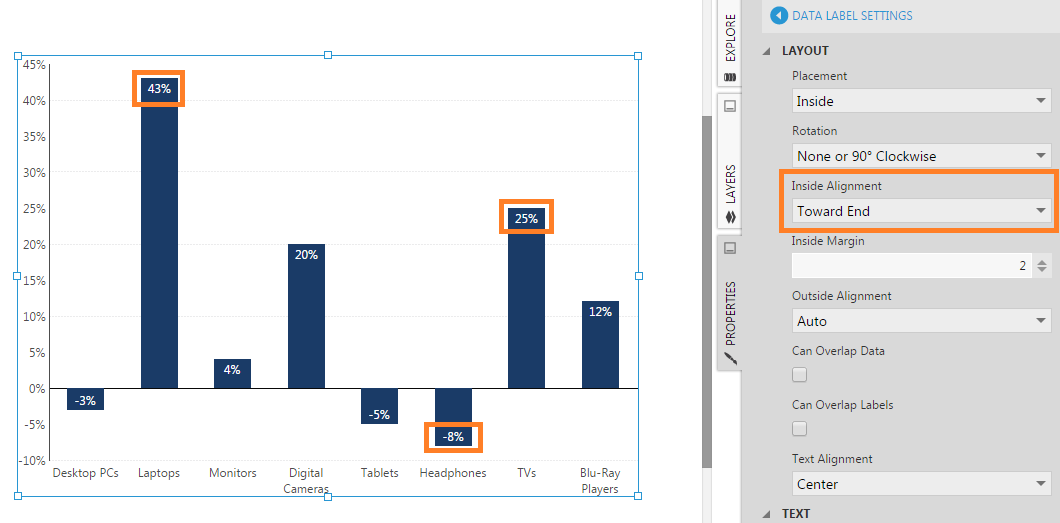
Data point labels displayed within the bars of a chart can be aligned towards the end of each bar (e.g. towards the maximum value). This applies to bar, area, and range charts, including stacked and curved types.
In the Data Label Settings properties, set the Inside Alignment to Toward End.
This will also work when the bars are horizontal (i.e. inverted axes). Go to the dashboard designer toolbar and click Horizontal Bars to see this.
