
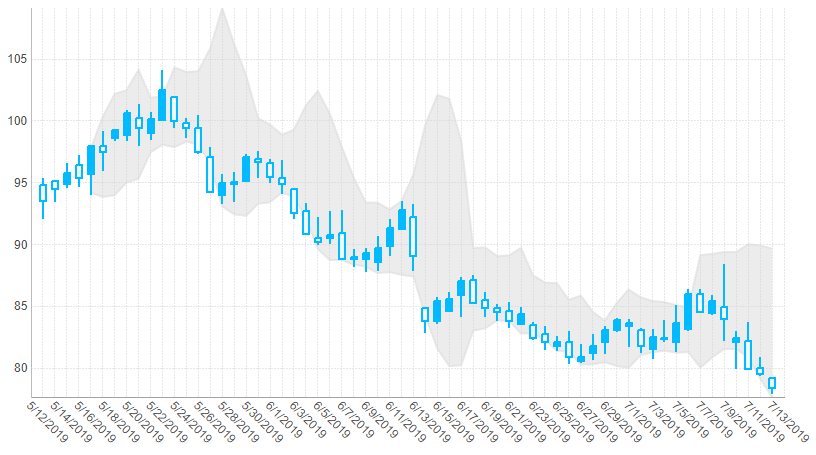
Bollinger Bands
The Bollinger Bands functions are based on methods developed by John Bollinger. They compute a pair of data values based on the moving average of the input value series.
Each value is derived by calculating a specified number of standard deviations based on the moving average of the selected input value series. Applications of Bollinger Bands include the measurement of stock price volatility.
Note
To use an exponential moving average instead of the simple one, see Moving Average Envelopes.
1. Syntax
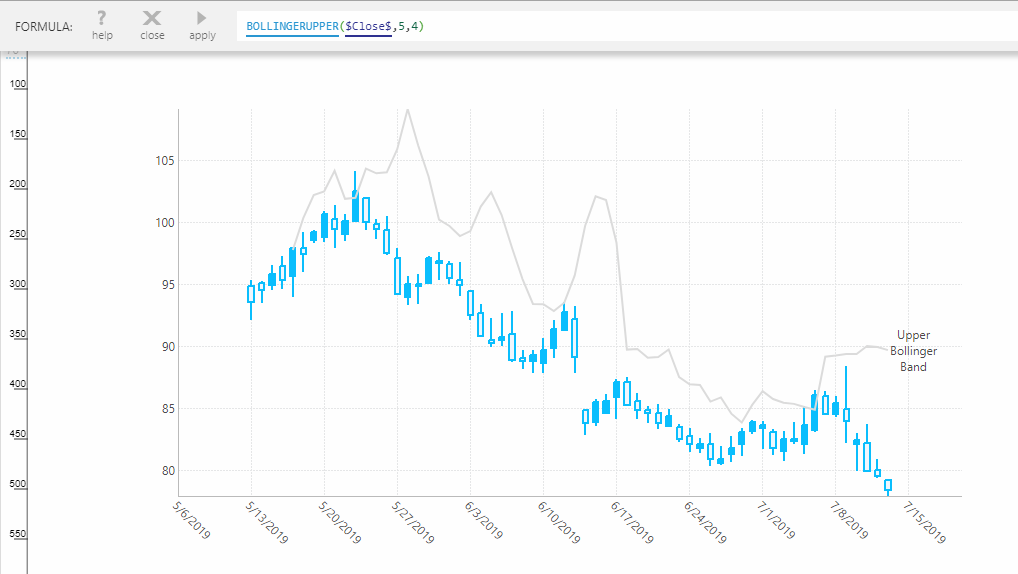
Upper Bollinger Band:
BOLLINGERUPPER(d0,s0,s1,Alignment)
Lower Bollinger Band:
BOLLINGERLOWER(d0,s0,s1,Alignment)
2. Input
The Bollinger Bands functions require the following input:
- d0 - The input data values for which the Bollinger Bands function is calculated.
3. Parameters
The Bollinger Bands functions accept the following parameters:
- s0 - Period - The number of time periods to use in the calculation. Default value is 10.
- s1 - Standard Deviation Shift - The number of standard deviations that is used to determine the values of the Upper and Lower Bollinger Bands in relation to the simple moving average. Default value is 2.
- Alignment (Optional) – Hierarchy placeholder to be used as the alignment axis.
4. Output
The Bollinger Bands functions generate the following output:
- Upper Bollinger Band - The Upper Bollinger Band result set.
- Lower Bollinger Band - The Lower Bollinger Band result set.