Read data from a visualization by script
1. Overview
Visualizations request a metric set's data from the server for display purposes only, and may not immediately include the entire result, for example if that data is currently scrolled out of view. The JavaScript API can be used to issue a request for a metric set's data for your own purposes.
Script Library sample: Insert scripted third party web content sample
2. Set up the visualization
The data for any visualization is always retrieved using metric sets in the same way, so the same script is applicable for all visualization types, or for any metric set if you specify its ID as the objectId.
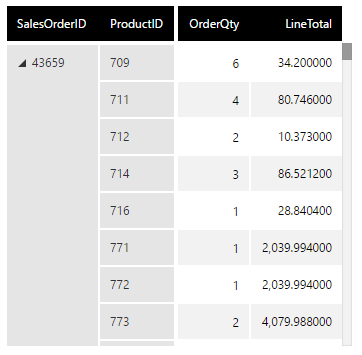
For this example, we are dragging data from a data cube or data connector to create a table on the dashboard canvas with the desired data. We can then request the same data displayed by this table using script.

3. Retrieve data
We will trigger script using a button for this example, choosing Components and then Button from the toolbar to add one.
In the Properties window under Actions, look for the button's Click actions. Click the + button to add a script action for retrieving data, then click the new item below to open the script editor and enter JavaScript like the following:
var dataRetrievalService = this.getService("DataRetrievalService");

// Create a Request object with our own paging settings:
var request = new dundas.data.Request({ objectId: table1.metricSetBindings[0].metricSetId });
request.pagingOptions.pagingKind = dundas.data.PagingKind.SEQUENCE;
request.pagingOptions.rowSequenceSize = 100;

// Request the data:
var def = dataRetrievalService.getData(request);

def.done(function(results) {
    // The request was successful:
    var cellset = results[0].cellset;
    debugger; // (check the result in the browser's debugging tools, then replace this line)
});
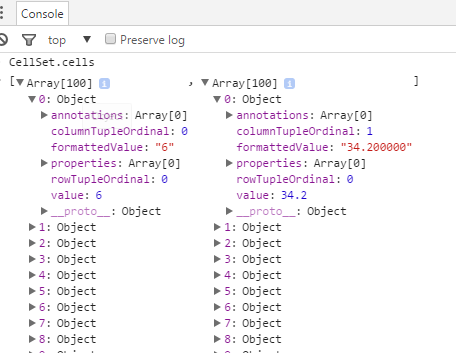
This example accesses data from the same metric set displayed by a table visualization with script name table1 on the dashboard. Once the cellset has been retrieved, the data contained in its rows, columns, and cells can be accessed: see the dundas.data.DataCellSet class in the JavaScript API reference for details. The cellset for the example above contains 100 rows:

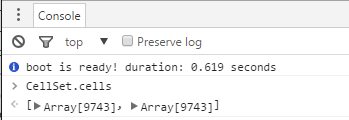
The dundas.data.Request class has options that can be customized. When pagingKind is set to dundas.data.PagingKind.NONE, all the rows in the table are retrieved:
The measure values can be accessed by looping through the nested cells array, e.g., cellset.cells[columnIndex][rowIndex]. As there are two measures in the table above, cells contains two arrays of size 100 (as specified in the paging options).
3.1. Retrieve filtered data
The request created in the code above will fetch all the data without filtering. To retrieve only data filtered like some visualization on the dashboard, parameter values should be included in the request.
Parameter values can be created in script as done in other articles, or parameter values could be copied from a visualization displaying the same metric set.
Assuming the same metric set is also dragged onto the dashboard, the code above could be modified as follows to refer to it (i.e., table1):
var dataRetrievalService = this.getService("DataRetrievalService");

// Create a Request object with our own paging settings:
var request = new dundas.data.Request({ objectId: table1.metricSetBindings[0].metricSetId });
request.pagingOptions.pagingKind = dundas.data.PagingKind.SEQUENCE;
request.pagingOptions.rowSequenceSize = 100;

// Get the last request from the visualization:
var vizRequest = table1.metricSetBindings[0].dataResult.request;

// Copy the parameter values, which will have matching parameterIds if for the same metric set:
vizRequest.parameterValues.forEach(function (parameterValue) {
    request.parameterValues.push(Class.clone(parameterValue));
});

var def = dataRetrievalService.getData(request);
def.done(function(results) {
    var cellset = results[0].cellset;
    debugger; // (check the result in the browser's debugging tools, then replace this line)
});
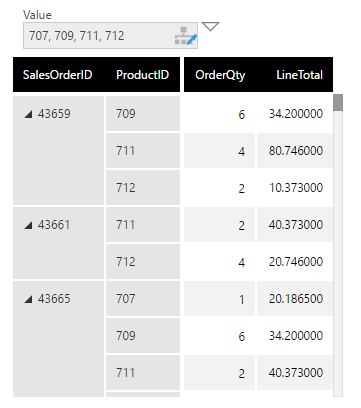
This cellset will contain only the rows and columns that match the filtering criteria. For example, if a filter is applied on the ProductID in the sample table:

cellset.cells contains only 9743 rows instead of the total available 12173 rows.


