Add a slicer comparison
1. Overview
This walkthrough shows you how to add a slicer comparison, which lets you apply different filter values to a measure and compare the results together.
2. Walkthrough
A slicer comparison measure can be added if you have numeric data (a measure) and a slicer to filter it by.
This example starts with a new metric set, but the same steps can be followed when editing a metric set checked out to you on a dashboard or another view.
2.1. Create a metric set
To create a new full screen metric set, choose Business in the main menu and click Create.
Choose a data source containing numeric data to use as a measure.
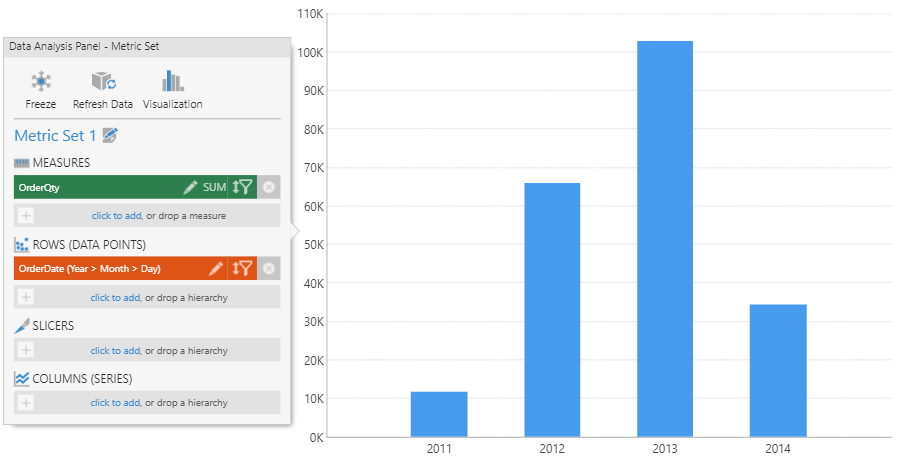
In our example, we chose a data cube containing the measure OrderQty, then dragged an extra time dimension hierarchy OrderDate from the Explore window to Rows (adding a hierarchy other than to Slicers is not necessary for a slicer comparison). After re-visualizing to a bar chart in the toolbar, this displays a bar for each year.
2.2. Add slicers
Add data under Slicers. In this example we dragged the Product hierarchy under Slicers.
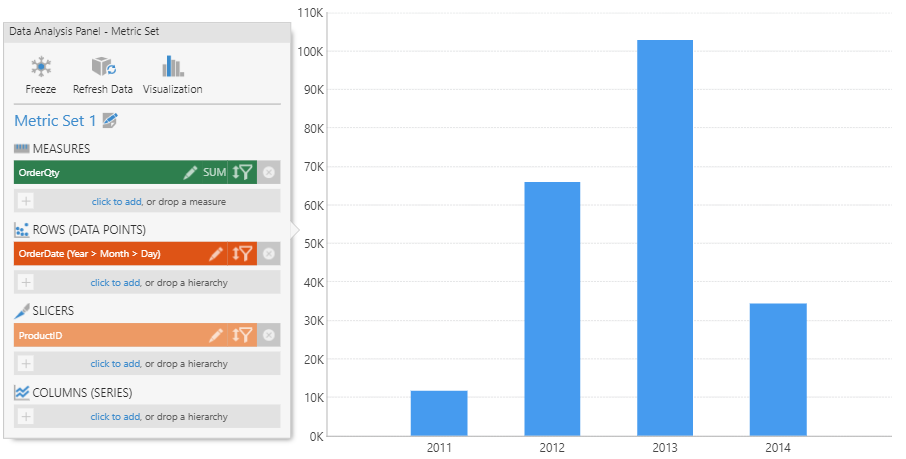
A slicer allows you to filter the measure values without changing how the data is grouped into rows, columns, or data points. You can choose to filter your slicer, but in this example we will leave its filter value as the default setting All.
2.3. Add a slicer comparison
The slicer comparison adds a 'parallel' version of the measure that's displayed alongside the original but can be filtered differently.
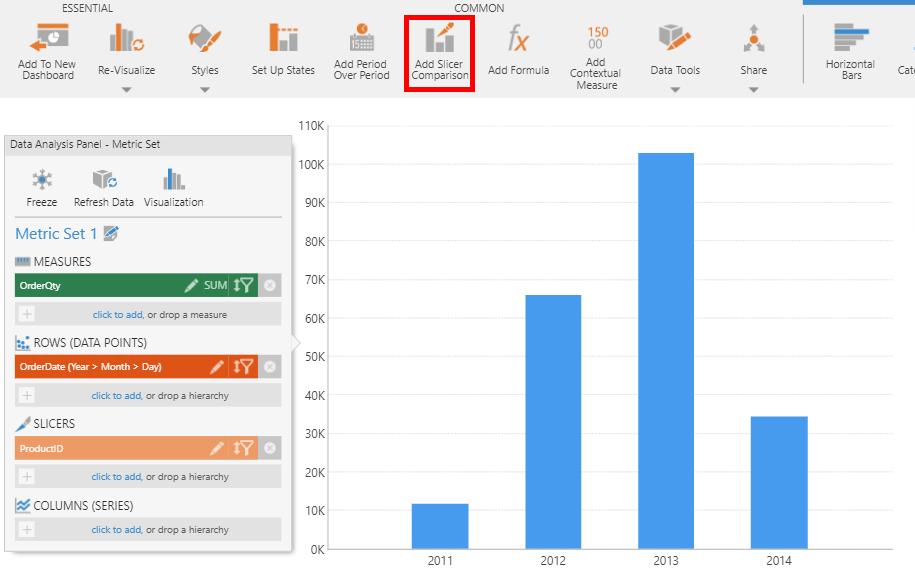
In the toolbar, click Add Slicer Comparison. This can be found under Data Tools if you are editing a view such as a dashboard.
In the Slicer Comparison dialog, confirm the Measure that you want to compare with different filtering (in our example there is only one).
Optionally provide a Parallel Slicer Measure Name, or leave it blank to generate one automatically.
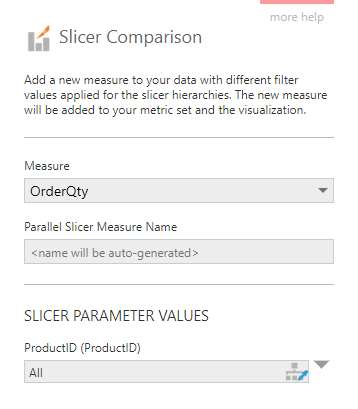
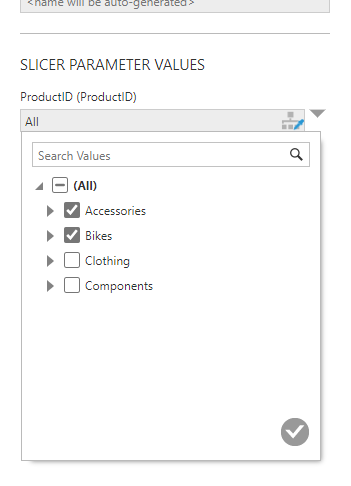
Specify the Slicer Parameter Values for each slicer that you added. In this example, the orders are filtered by the product values Accessories and Bikes.
Click the Submit button at the bottom of the dialog when finished.
A new slicer measure is added to the metric set and can be seen in the Data Analysis Panel. The visualization is updated to show the newly added slicer measure for comparison.
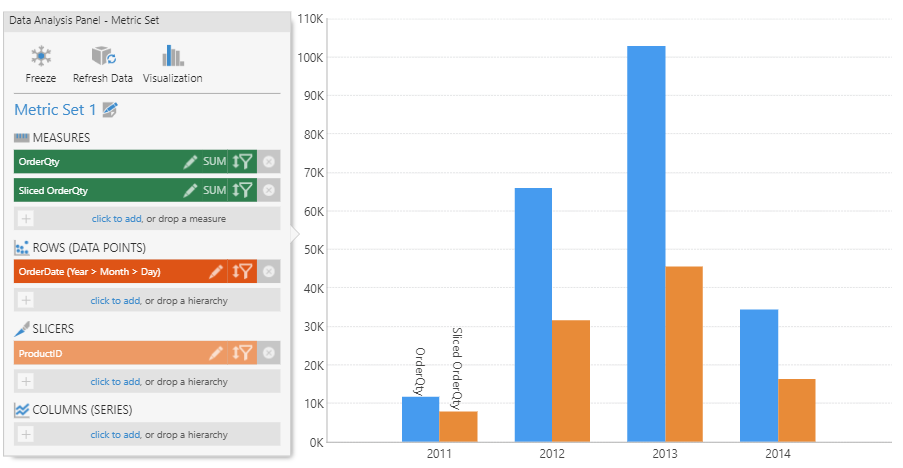
In this example, the slicer comparison allowed us to easily compare the order quantity for Accessories and Bikes (in orange) against the total order quantity for all products (in blue) for each year.
3. Add a filter to change while viewing
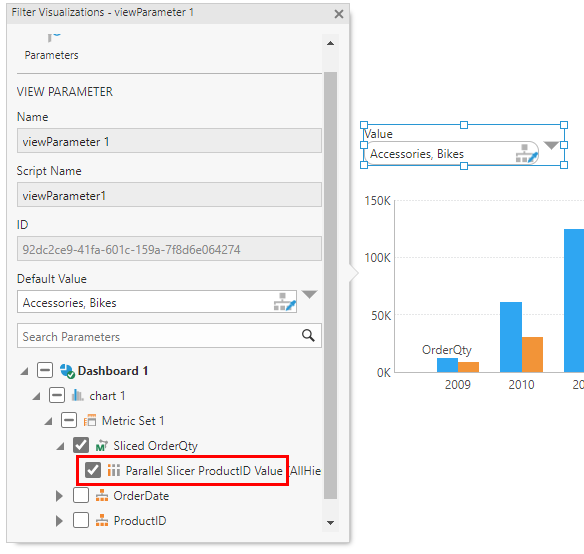
The slicer parameter values specified above can be changed while viewing the metric set on a dashboard or another view by adding a filter or a view parameter and connecting it to a parallel slicer parameter.
For example, add a hierarchy Value filter and connect it to one of the parallel slicer parameters under the slicer measure. (Disconnect it from other parameters, such as the original slicer hierarchy ProductID in this example).