Use a drop down list to switch metric sets with scripting
1. Overview
This article shows you how to program a drop down list component to switch the metric sets displayed by a chart. We will use JavaScript that runs in the drop down list's Selection Changed action.
Keep in mind that there are options to accomplish a similar result without script by setting up charts in two dashboard layers and using Change Layer actions. The purpose of this article is to demonstrate how additional custom functionality is possible using Dundas BI APIs.
2. Create metric sets
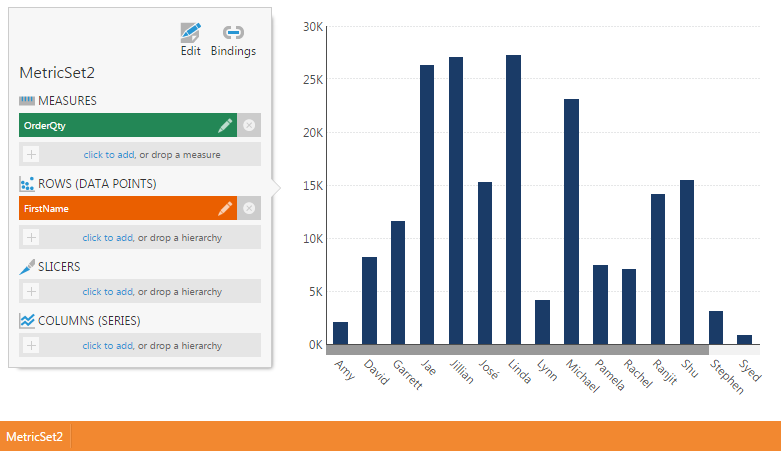
For this example, create two metric sets that will be switched using the drop down list.
2.1. Record the IDs of the metric sets
In order to reference the metric sets from script, you'll need to get their IDs.
For each metric set, go to the Explore window and locate it in the Metric Sets folder.
Right-click on the metric set, and then select Properties from the menu.
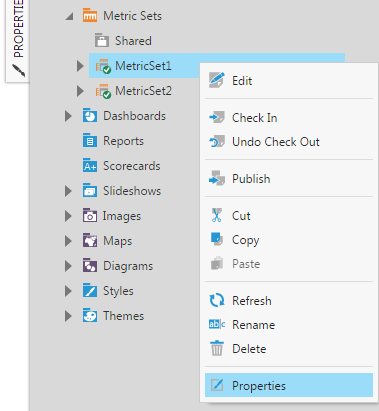
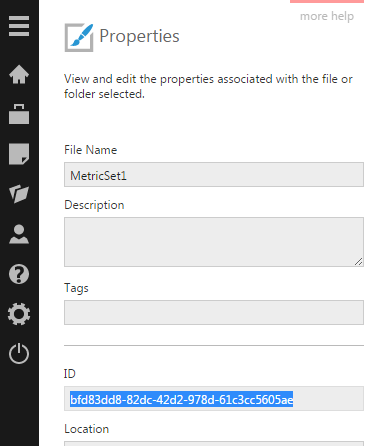
In the Properties dialog, locate the ID field and copy the text to the clipboard. You can paste the two IDs into another application now, or copy them the same way later while editing the dashboard.
3. Design the dashboard
Create a new dashboard, then drag the first metric set from the Explore window to the canvas.
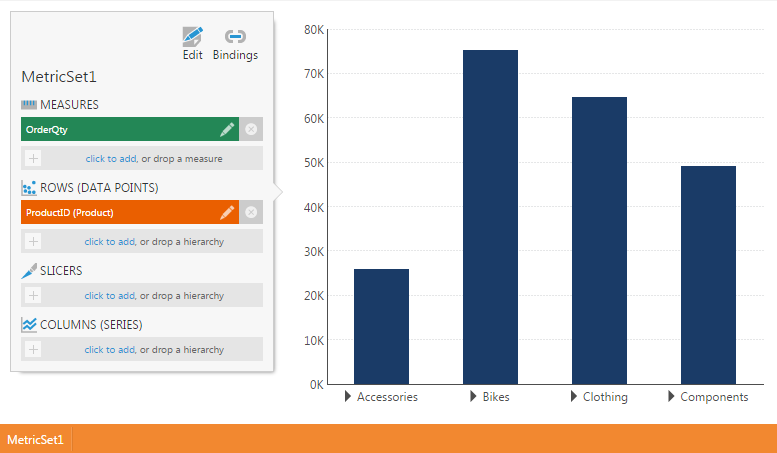
The metric set appears as a chart visualization named chart1.
3.1. Add a drop down list
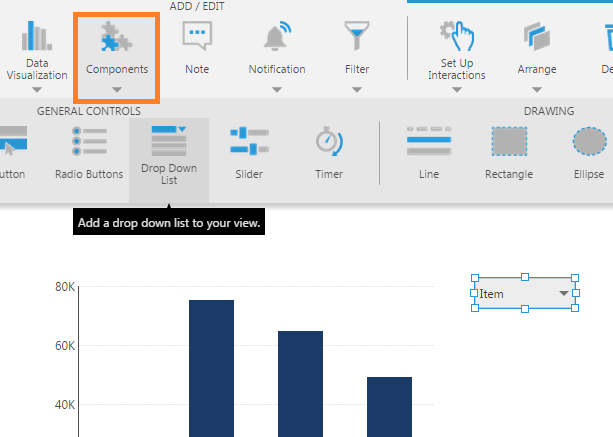
Next, click Components in the toolbar, then select the Drop Down List component.
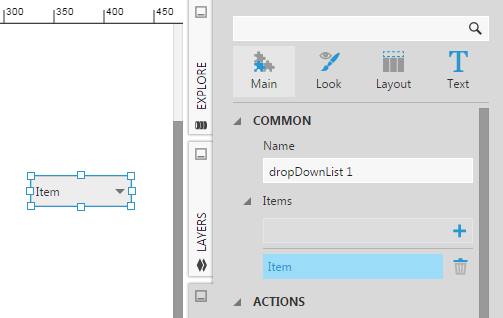
A drop down list component is added to the dashboard canvas.
3.2. Configure drop down list items
Select the drop down list on the canvas, and then open the Properties window.
You'll see that the drop down list is configured with a single item by default. Click the item to modify it.
Under Animation & Interaction in recent versions, paste the ID from the first metric set into the Value property. Set the Caption property to OrderQty by Product.
Click the back button at the top of the properties to go back to the list of items.
Click the + button to add a second item, then click the new item to edit it.
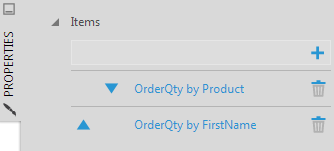
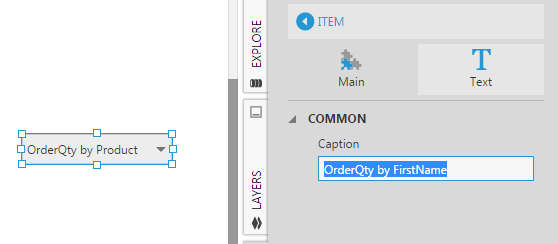
Paste the ID from the second metric set into the Value property, and set the Caption property to OrderQty by FirstName.
Click the back button at the top of the properties to go back to the list of items. The drop down list has two items configured now.
4. Add a script
In the properties for the drop down list, go to the Actions tab and click + to add an action (find Actions in the Main tab in previous versions).
Add an action for Selection Changed, and choose a Script action. Edit the script action to open the Script Editor, and paste the following JavaScript code.
// Get the metric set ID value from the drop down list.
var metricSetId = dropDownList1.value;

// Update the chart with the selected metric set.
chart1.metricSetBindings.length = 0;
chart1.generateMetricSetBinding(metricSetId, true);
Click Build to check for any script errors. (There's no need to save because the Script Editor auto-saves as you type.)
4.1. Re-connect Filters
If the metric sets have a filter connected to it, the connection is lost when switching the metric sets. The filter can be re-connected by adding a done() callback to the generateMetricSetBinding() method.
An update to the JavaScript code above will look like this:
// Get the metric set ID value from the drop down list.
var metricSetId = dropDownList1.value;
var parameterName = "viewParameter1"; // the Script Name of the view parameter
var parentView = this.parentView;

// Update the chart with the selected metric set.
chart1.metricSetBindings.length = 0;
chart1.generateMetricSetBinding(metricSetId, true).done(function (result) {

  // Get the view parameter
  var viewParameter = parentView.control.getViewParameterByName(parameterName);

  // Find the metric set's hierarchy usage
  var element = result.metricSet.rowHierarchies[0];

  // Re-link the filters
  var elementParameterLink = new dundas.view.ElementParameterLink({
    "adapterId": chart1.id,
    "metricSetBindingId": result.metricSetBinding.id,
    "elementUsageUniqueName": uniqueName,
    "parameterId": element.parameter.id
  });
  viewParameter.clearElementParameterLinks();
  viewParameter.addElementParameterLink(elementParameterLink);
  viewParameter.refreshAllAdapters(null, parentView);
});
4.2. Using table visualizations
If your two metric sets are visualized as tables (instead of charts), the script portion that updates the table with the selected metric set is slightly different.
// Update the table with the selected metric set.
table1.metricSetBindings.length = 0;
table1.control.columns = [];
table1.control.rowHeaderColumns = [];
table1.generateMetricSetBinding(metricSetId, true);
5. Using the drop down list
Choose Sandbox View in the toolbar to test the script in a new tab without saving results of running the script, and then use the drop down list to choose which metric set to display in the bar chart.


