Dundas Data Visualization Blog

Dundas BI 4 - Visualization
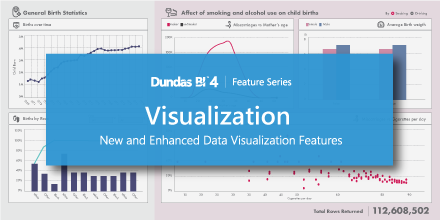
Welcome to the third and final installment of our Dundas BI 4 – Feature Series Webinars blogs. These blogs are dedicated to providing more detail in preparation of their respective webinars, which are hosted by Dundas’ R&D teams. Each individual webinar in the series focuses on a different area of the product, giving you valuable insight into how specific segments of the product have been enhanced in Dundas BI 4. If you haven’t had the opportunity to watch the first 2 webinars, or if you missed one of them, be sure to check them out:

 

Read more >

Dundas BI 4 - Integration

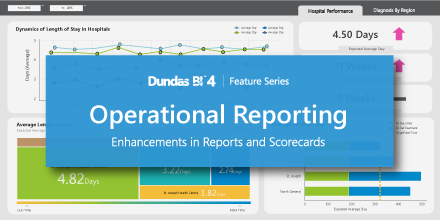
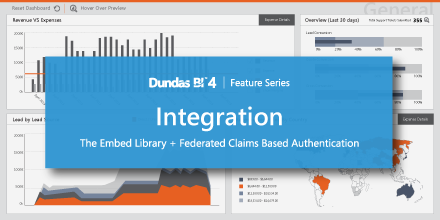
Welcome to the second installment of our Dundas BI 4 – Feature Series webinars blog. If you missed our first webinar on Operational Reporting, you can either read about it here, or watch the in-depth webinar hosted by Dundas’ Reporting Lead Developer Kevin Micallef, here.

Read more >

Dundas BI 4 - Operational Reporting

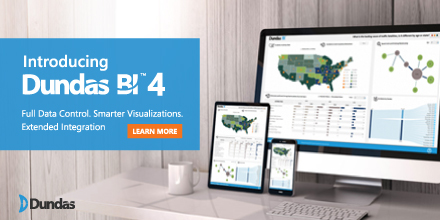
Dundas BI 4 was released this week, and with it, over 100 new features and enhancements designed to give you unparalleled control over your data. With Dundas BI 4, data consumers, business analysts and BI professionals get greater control of their data and the freedom to work without depending on others. 


Read more >

Dundas BI 4 Has Arrived!

At Dundas Data Visualization, everything we do is driven by our passion for creating innovative software to help businesses solve real business problems. It’s with this mentality, that we continually strive to provide solutions that help businesses transform their data into actionable information so they can improve corporate performance and become more data-driven. 

Read more >

25 Visualizations for 25 Years

25 Unique and Smart Visualizations you can Easily Create in Dundas BI

In the spirit of celebrating 25 years of data visualization innovation, we took on the daunting task of picking 25 unique and smart visualizations you can easily create in our most modern BI and Analytics platform – Dundas BI. Some of the visuals are unique and won’t be found in other tools, and some of the visuals are smart and automatically created for you by Dundas BI without any data prep required. Plus, we’ll show you some cool techniques and concepts you may have not considered before.


Read more >

Dundas Data Visualization, Inc.
400-15 Gervais Drive
Toronto, ON, Canada
M3C 1Y8

North America: 1.800.463.1492
International: 1.416.467.5100

Dundas Support Hours:
Phone: 9am-6pm, ET, Mon-Fri
Email: 7am-6pm, ET, Mon-Fri