Dundas Data Visualization Blog

Pareto Charts - The Vital Few vs. The Trivial Many
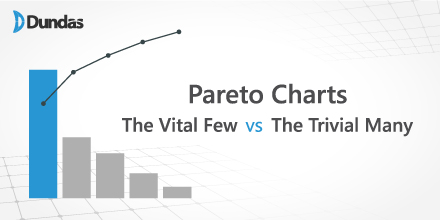
The Pareto Chart is a unique visualization in that it contains both bars and a line graph, where individual values are represented in descending order by bars, and the cumulative total of those values is represented by the line from left to right. For instance, the line begins at the top of the first bar, and as we move right, towards the second bar, the line displays the combined total of both bars as a percentage, representing the total share of these 2 items (i.e. products) out of the entire group of items. Upon reaching the final bar, the line’s total will always be equal to 100%, representing the cumulative percentage share of all the bars (items). 


Read more >

6 Key Capabilities an Embeddable Analytics Software Should Deliver

Business intelligence (BI), analytics, and data visualization software is becoming a key component of any organization looking to take more data-driven actions. The acquisition of a BI tool that allows for full control, visual exploration, preparation and transformation of data so that organizations can deliver it in the most actionable way is highly coveted. But companies aren’t just clamoring for a BI solution for internal purposes; they’re looking to differentiate their own applications with beautiful analytics to better serve their external customers. Whether it’s to enhance their client’s web portals with better reporting, integrate dashboards into their on-premises and SaaS offerings, or build an entirely new data application from scratch, they are asking for a BI and analytics solution to be embedded within their business applications.


Read more >

4 Simple Ways to Supercharge your Sales Strategy with Business Intelligence

It’s vital that sales teams are equipped with the right tools to properly analyze and interact with their data. A flexible business intelligence and data visualization solution, with tailored capabilities, will be able to help a sales team monitor performance, identify which sales techniques are working, and improve customer service, all while allowing them to discover new opportunities. By having a centralized dashboard that allows sales teams to analyze, view and interact with the right data the way they want to; they’ll see an increase in alignment and collaboration, which will ease the identification of complex problems, transfer of expertise, and recognition of growth opportunities. 


Read more >

Business Intelligence - Why Do I Need That?

Business Intelligence.  You hear your boss utter those words and immediately your eyes are drawn to your notepad.  Scribbled hastily between two reports is a 5x5 box; Synergy, Content-Driven, Value-Added, Fault Tolerant… One more and you can shout BINGO. A sigh of relief escapes as you realize Business Intelligence isn’t more jargon or reference to some arcane business process, but rather a term that albeit confusing, is very important.  

Read more >

The Best of 2016

Resources we love, that you may have missed

It is officially 2017 and we’ve been thinking a lot about our favorite blogs, webinars and other valuable resources from the past year.  This isn’t a comprehensive list, but here are some resources you may have missed or that we think are worth reading.

Read more >

Dundas Data Visualization, Inc.
400-15 Gervais Drive
Toronto, ON, Canada
M3C 1Y8

North America: 1.800.463.1492
International: 1.416.467.5100

Dundas Support Hours:
Phone: 9am-6pm, ET, Mon-Fri
Email: 7am-6pm, ET, Mon-Fri