Setting up data input
1. Overview
The ability to add and modify data within the application is built-in, with data then stored in its warehouse data storage area. This data can then be used as a data source.
Since you are inputting the data and it is stored in the warehouse, you do not need to use a data connector for this functionality. Other than the lack of an explicit data connector, data input follows the usual Data Model that relies on data cubes and metric sets to display data on dashboards, reports, and scorecards.
When you want to input a new set of data, you have three options:
- Create a data cube with a Data Input transform. You can then use the data cube to create metric sets, or as a storage area for data input by viewers using a data input interaction.
- Create a new metric set based on data that you enter. You can then use the metric set in a view such as a dashboard.
- Create a new visualization in a dashboard or other view and enter new data into it.
2. Setting up data input in a data cube
You can add a Data Input transform directly to a data cube when editing it. For details, see Data Input Transform.
You can then add data to this transform yourself, or set up a data input interaction for viewers to add to it.
3. Entering data into a new metric set
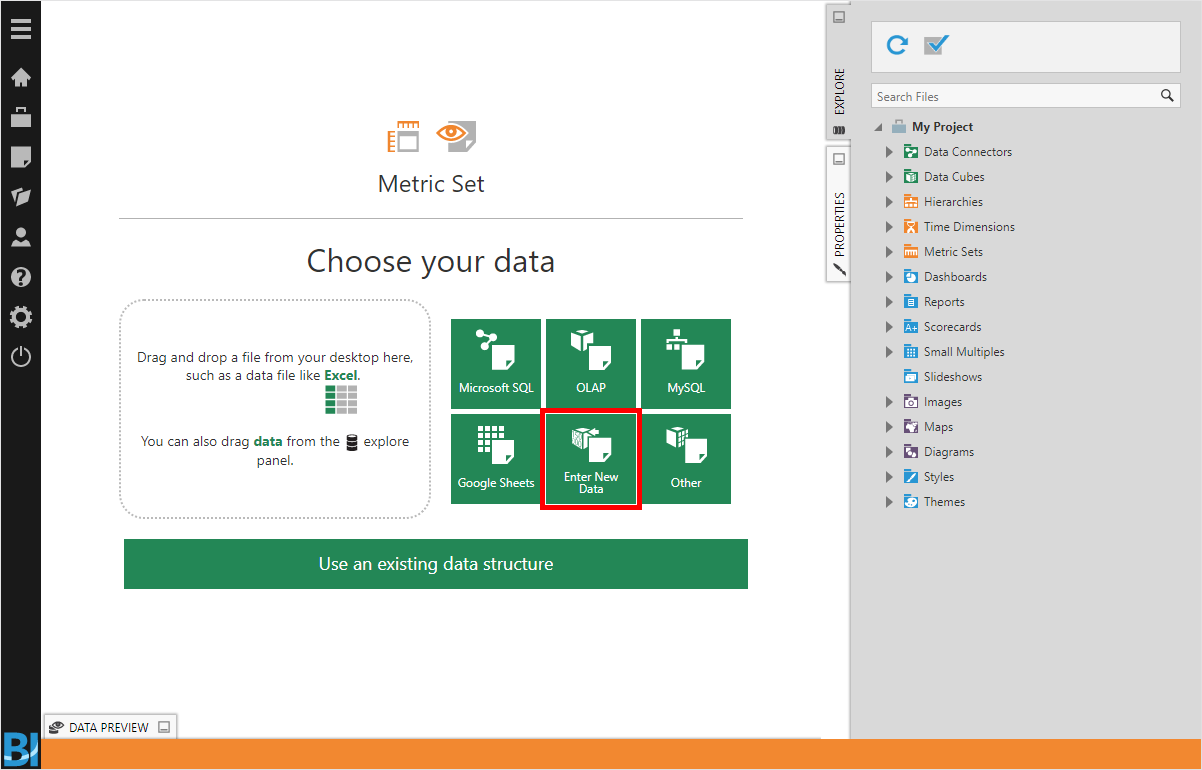
On a new metric set, click Enter New Data.
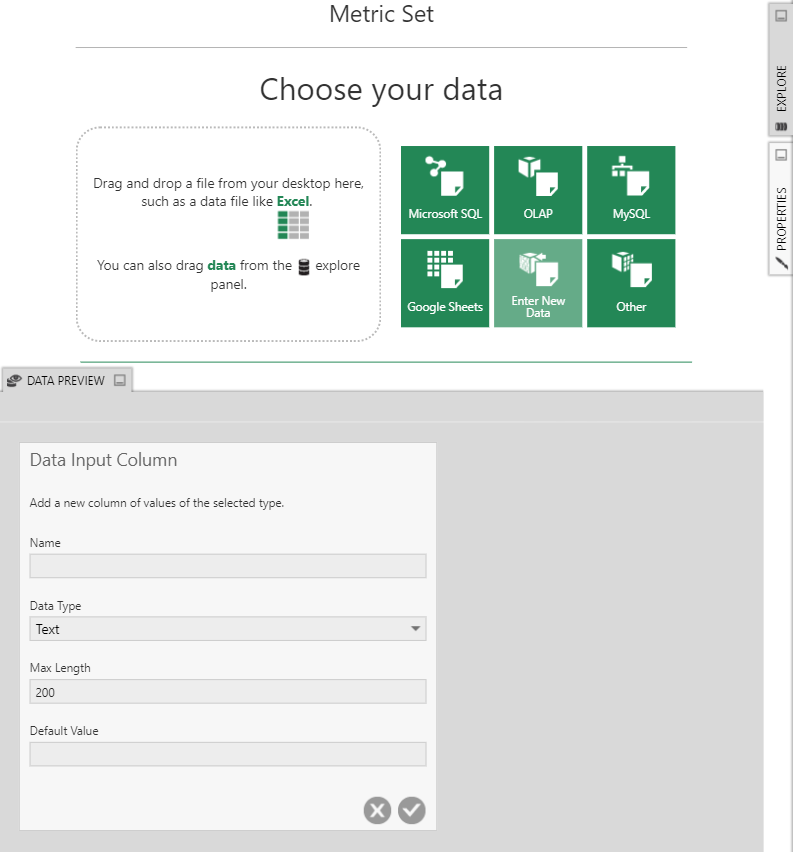
The Data Preview window automatically expands to show the Data Input Column dialog. Provide a Column Name and select the Column Data Type, and then click Submit.
The Data Input Column dialog is replaced with a single-column table in the Data Preview window. Type data into the cells to input data. Type Enter to create or move to the next row, and Tab to create or move to the next cell to the right.
Right-click to insert a row or create a new column, or move the mouse and click the plus icon when it appears where you want to add a row or column.
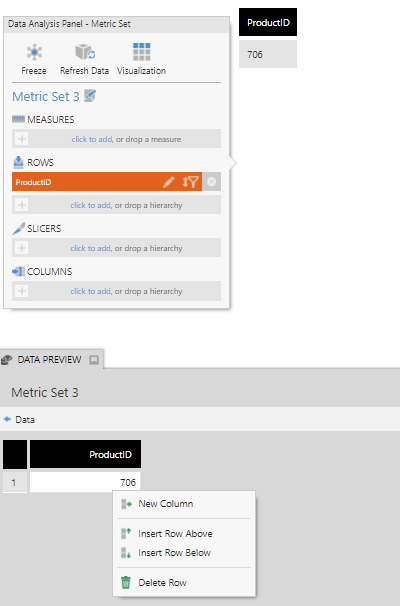
Like any other metric set, you can now re-visualize and customize this metric set.
4. Entering data when editing a dashboard
When editing a dashboard, add a new data visualization from the toolbar (for example, a bar chart).
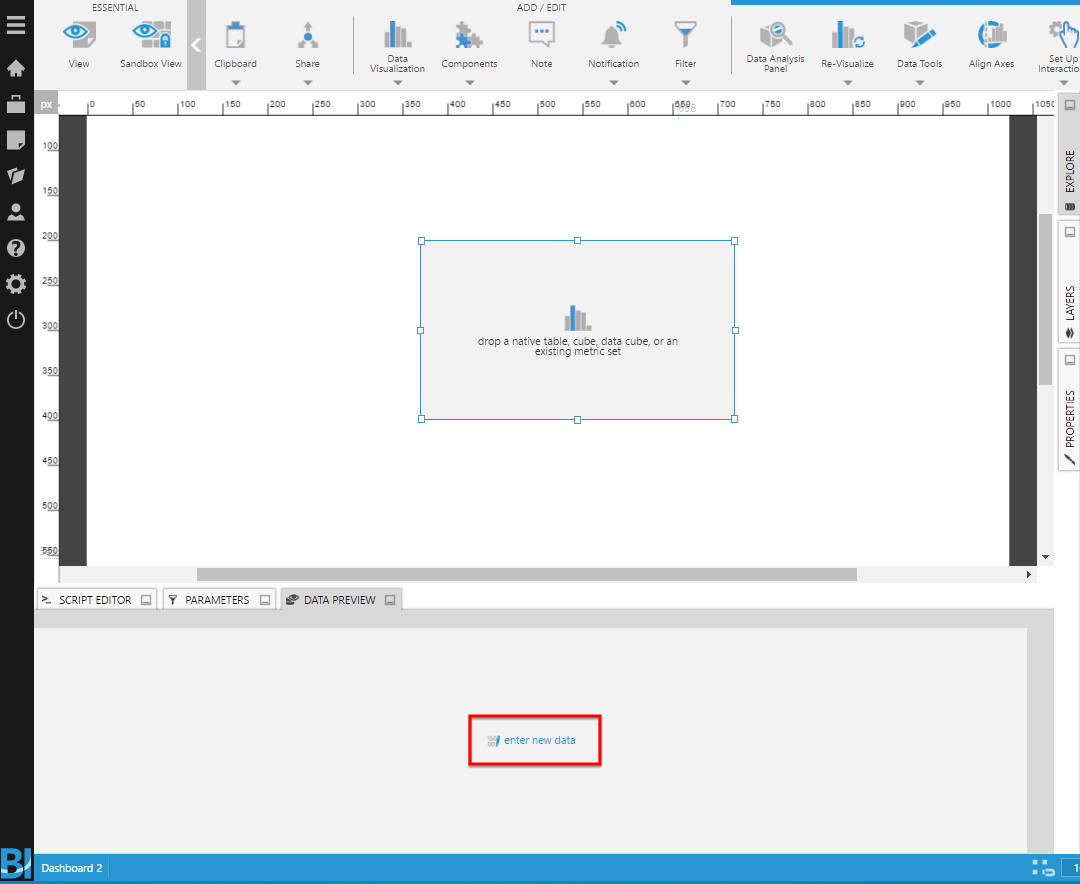
Open the Data Preview window and click enter new data.
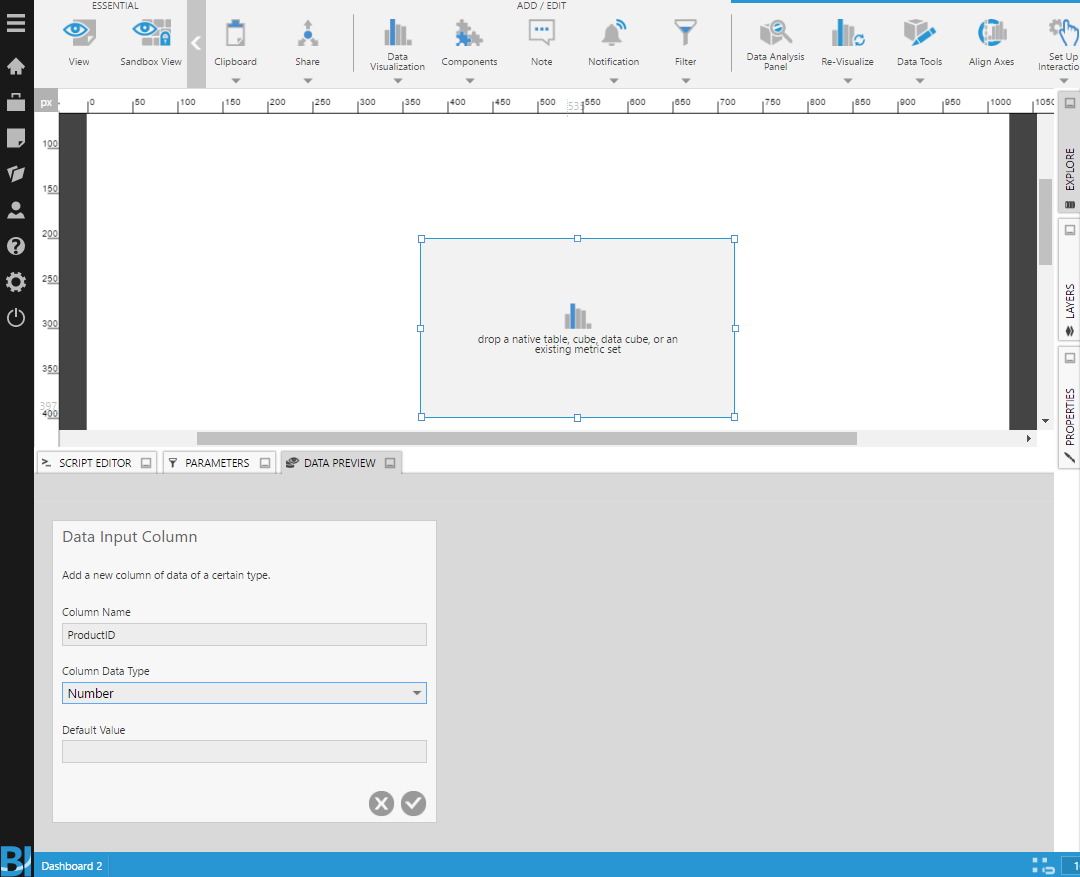
The Data Preview window automatically expands to show the Data Input Column dialog. Provide a Column Name and select the Column Data Type, and then click Submit.
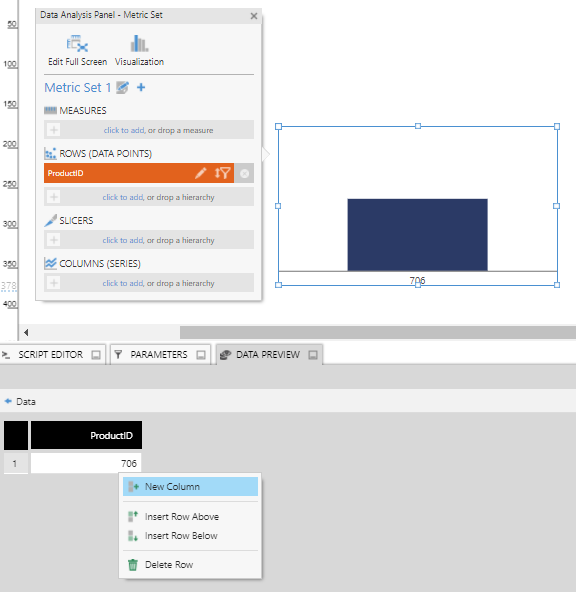
The Data Input Column dialog is replaced with a single-column table in the Data Preview window. Type data into the cells to input data. Type Enter to create or move to the next row, and Tab to create or move to the next cell to the right.
Right-click to insert a row or create a new column, or move the mouse and click the plus icon when it appears where you want to add a row or column.
5. Modify input data
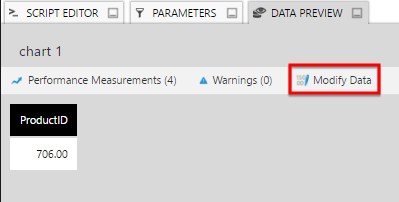
No matter where you initially set up data input, when working with this data you can access the editable table again to make changes. To modify input data, open the Data Preview window, and click Modify Data.
5.1. Pasting data
If you have existing data in another application, you can copy multiple values into the data input table.
Copy (press Ctrl+C or ⌘+C) some columns and rows of data from the other application, then click a cell in the Data Preview window and paste (Ctrl+V or ⌘+V).
The pasting action works from left to right and from the top down, which means the cell you selected should correspond to the top-left cell of your pasted data. If that cell does not exist yet, you can quickly add a new line by hovering over the last cell and clicking the plus icon that appears where the row will be inserted.
5.2. Deleting rows
You can right-click a row and choose Delete Row.
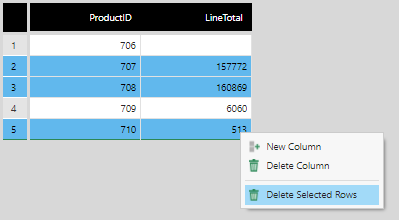
To delete multiple rows, select them by clicking the numbers on the left while holding Ctrl or Shift on your keyboard (tap the row numbers on touch devices). Right-click (or long-tap) the table when rows are selected and choose Delete Selected Rows.
6. Notes
- Deleting a column from the Data Input is postponed until after you check in. This means you will be unable to create a column with the same title as the deleted one until you check in and check out.
- Changes to rows of data are not affected by check in or check out states, since viewers or end users can be allowed to make changes. Undo Check Out does not change or remove data.
- When using the data input feature, you cannot enter data using tokens. It is suggested to disable the token picker when using it for these purposes.


