1. Overview
This article shows an example of using R for analysis, creating clusters using a K-means model. K-means clustering aims to partition a number (n) of observations into a number (k) of clusters, in which each observation belongs to the cluster with the nearest mean, serving as a prototype of the cluster. Clustering can help identify different groups in your data that should receive special treatment based on their characteristics (for example, a defined custom marketing campaign for a certain cluster).
2. Prepare the data
The following example uses the Iris data set. This data set contains sepal and petal measurements, which are used to predict the species of the iris plant by classifying the data points into different clusters.
If necessary, first install and configure R and Rserve.
3. Create the data cube using Rserve
Create a data cube that retrieves your data from any source, such as a database, Excel file, or a flat file such as the iris data file provided in CSV format.
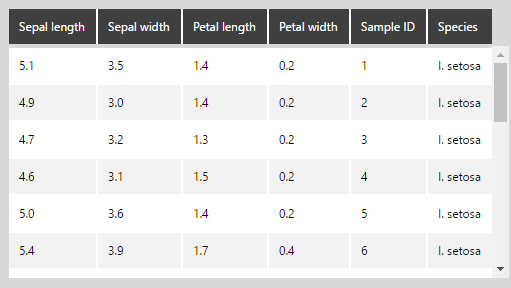
The following shows the iris data in our example with column names assigned:
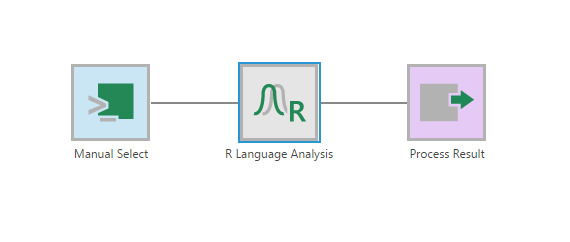
Using the Insert Other option in the toolbar, add an R Language Analysis transform after the Select transform.
Configure the R Language Analysis transform and add the following script:
#Define an argument for each column in the data set.
arg1 <- $PetalLength$
arg2 <- $PetalWidth$
arg3 <- $SepalLength$
arg4 <- $SepalWidth$
arg5 <- $Species$
arg6 <- $SampleID$

#Use the K-means algorithm to classify the Petal Length, Petal Width, Sepal Length, and Sepal Width into three clusters
result <- kmeans(data.frame(arg1, arg2, arg3, arg4), 3);

#Dundas BI requires that the output be in the form of a data frame
output <- data.frame(arg1, arg2, arg3, arg4, result$cluster, arg5, arg6);
This script is using the K-means clustering algorithm, which requires multiple arguments and defines the number of clusters to generate out of those variables.
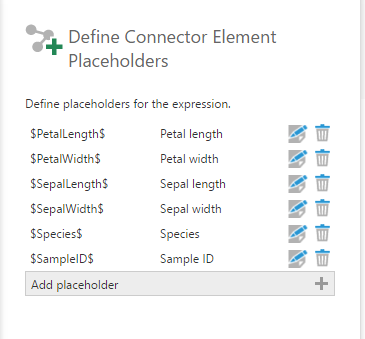
In the same configuration panel, click Define Element Placeholders and add the placeholders for all the arguments defined in the script. Make sure the column names match with something that the R script recognizes.
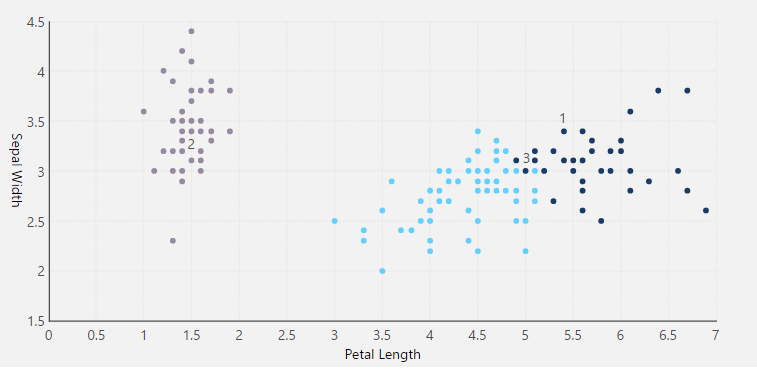
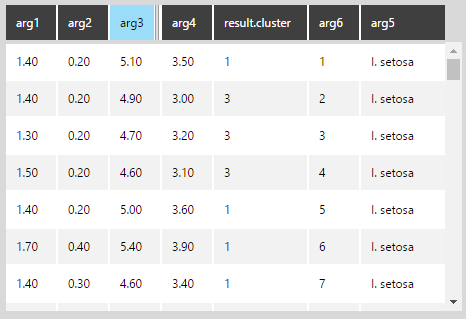
Open the data preview. You can see that the new result.cluster column, which is classifying each data point into clusters 1, 2, or 3.
4. Using SQL Server R Services
Alternatively, if you are using a database such as SQL Server or Azure SQL with R Services or Machine Learning Services, you may be able to run R script as part of the SQL query in a Manual Select transform.
Create a Manual Select data cube using the following script:
exec sp_execute_external_script
      @language = N'R'
    , @script = N'
		df <- data.frame(InputDataSet)
		arg1 <- df$SepalLength
		arg2 <- df$SepalWidth
		arg3 <- df$PetalLength
		arg4 <- df$PetalWidth
		arg5 <- df$Species
		arg6 <- df$SampleID

		result <- kmeans(data.frame(arg1, arg2, arg3, arg4), 3);
		OutputDataSet <- data.frame(arg1, arg2, arg3, arg4, result$cluster, arg5, arg6);
		'
	, @input_data_1 = N'
Select 5.1 As [SepalLength], 3.5 As [SepalWidth], 1.4 As [PetalLength], 0.2 As [PetalWidth], ''I. setosa'' as [Species], 1 As [SampleID] UNION ALL
		Select 4.9, 3, 1.4, 0.2, ''I. setosa'', 2 UNION ALL
		Select 4.7, 3.2, 1.3, 0.2, ''I. setosa'', 3 UNION ALL
		…………
		Select 6.5, 3, 5.2, 2, ''I. virginica'', 148 UNION ALL
		Select 6.2, 3.4, 5.4, 2.3, ''I. virginica'', 149 UNION ALL
		Select 5.9, 3, 5.1, 1.8, ''I. virginica'', 150'
WITH RESULT SETS (([Sepal Length] float, [Sepal width] float, [Petal length] float, [Petal width] float, [Cluster Result] int, [Species] varchar(MAX),[Sample ID] int));
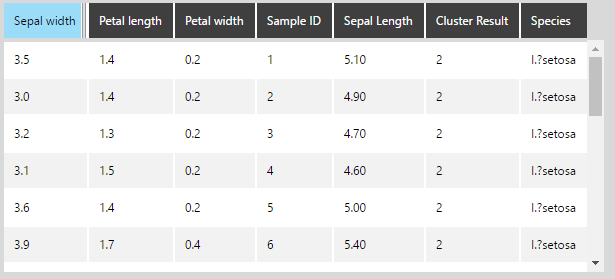
This script specifies the language (i.e., R) and executes the K-means algorithm as a standard stored procedure. It also includes the Select statements for retrieving the data points from the database.
The same result is obtained as with using Rserve:
5. Use the results
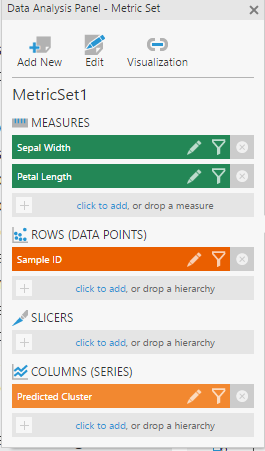
From the data cube created above, select the two measures, and add Sample ID to Rows in the Data Analysis Panel of a metric set.
Add the Predicted Cluster dimension to Columns, so that each Sample ID is grouped by the cluster.
Revisualize to a Scatter Plot. You will see that all the samples are grouped by cluster.