Promoting an auto-generated metric set
1. Overview
You can analyze data by simply dragging data from data connectors or data cubes directly onto the canvas of a dashboard or other view, so that you don't need to create a metric set ahead of time as a separate step, and to easily work with multiple metric sets together. This is handled by creating automatically generating a metric set for you.
These metric sets are part of the dashboard or view itself, so they can only be found under that view in the Explore window rather than the Metric Sets folder, and they share a revision history with the rest of the dashboard/view. You can promote a metric set to the Metric Sets folder to make it easier to share and reuse it.
Similarly, you can drag data directly from a data connector onto a metric set or view rather than creating a data cube ahead of time. This automatically generates a data cube behind the metric set in a similar way. This way, you can always choose to take advantage of all of the options in the full data model later.
2. Creating a metric set in a dashboard
As an example, first create a new dashboard from the main menu. Then perform some basic analysis as follows.
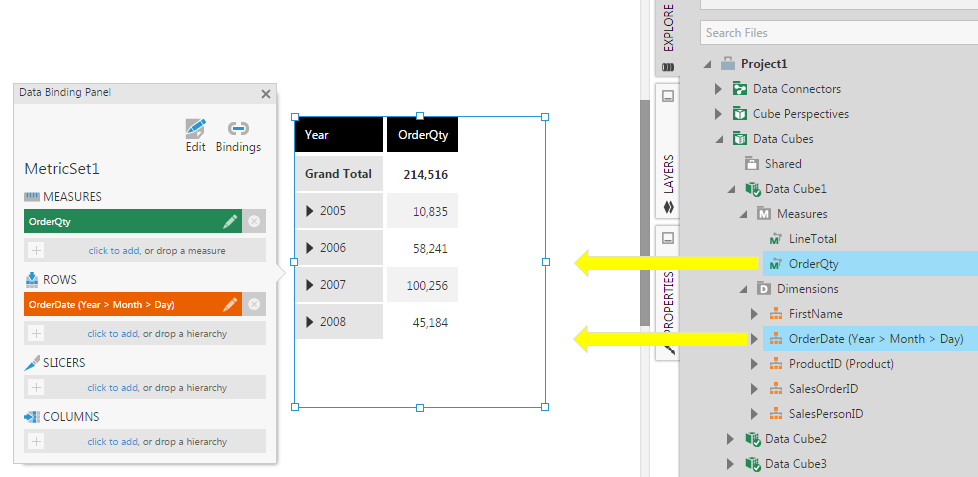
Go to the Explore window and drag a measure column from a data cube (or data connector) to the canvas. A table visualization appears which shows a single aggregated measure value.
Drag a dimension column from the data cube to the table visualization. The table is reconfigured to show the measure value for each row.
This visualization is powered by an underlying, auto-generated metric set.
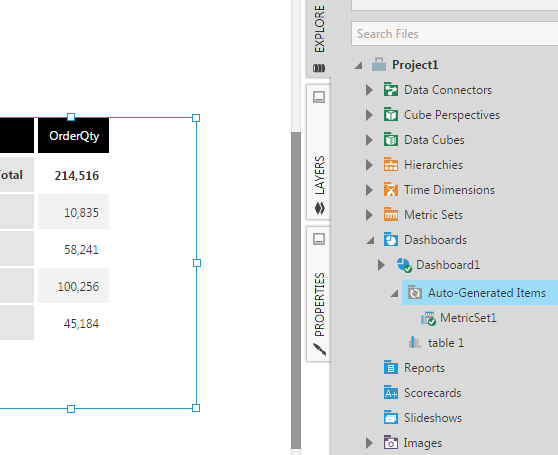
Next, go to the Explore window, locate your dashboard, and expand it. You should see an Auto-Generated Items folder appear under your dashboard which contains Metric Set 1.
3. Promote the metric set
This auto-generated metric set means you can always choose later to move it to the regular Metric Sets folder to make it easier for you or your team to find it, even if you started by quickly dragging some data onto the canvas.
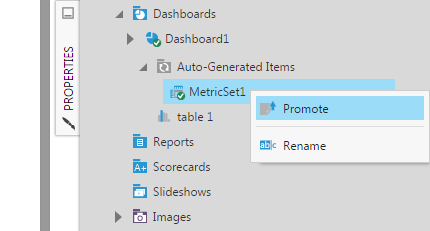
To promote the metric set, right-click (long-tap) on it in the Auto-Generated Items folder under its dashboard or view. From the menu, choose Promote.
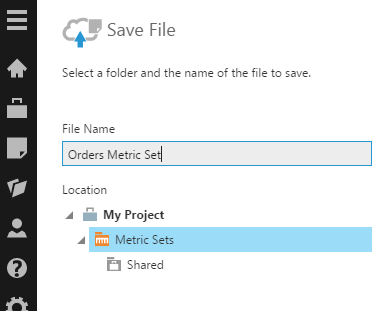
In the Save File dialog, optionally edit the File Name for the promoted metric set, and select the Location where it should be placed. Then click the submit button at the bottom of the dialog.
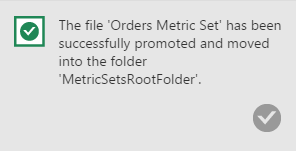
You'll see a message indicating the metric set has been promoted (and moved).
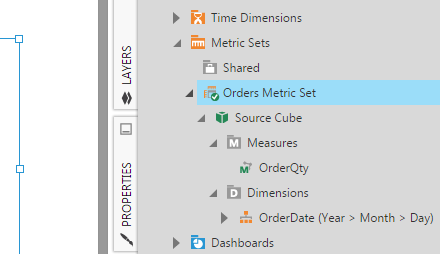
Go to Metric Sets in the main menu, or expand the Metric Sets folder in the Explore window to see the promoted metric set, which is now easier to find and reuse. You can now check in this metric set to give others access to it as well. Also note that the dashboard in this example no longer has an Auto-Generated Items folder.
4. Auto-generated data cubes
In the same way, when dragging data directly from a data connector from a table or another structure besides a cube, a data cube is generated automatically.
For example, create a new metric set and drag or use data directly from a data connector or an Excel spreadsheet.
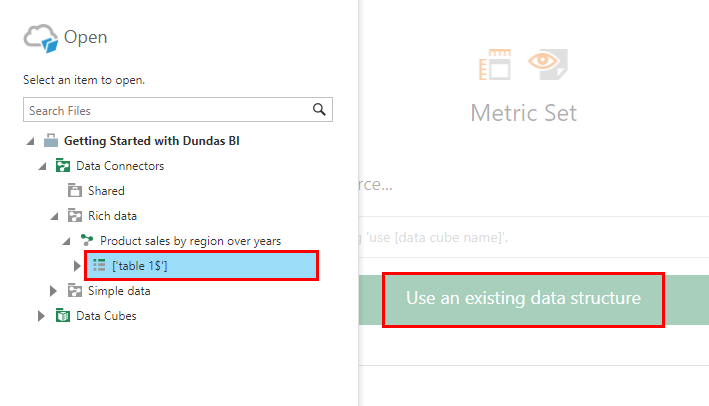
If you clicked Use an existing data structure, the Explore window now displays the auto-generated data cube based on your data source. All metric sets have a data cube like this one behind the scenes if you dragged data from a data connector without an existing cube.
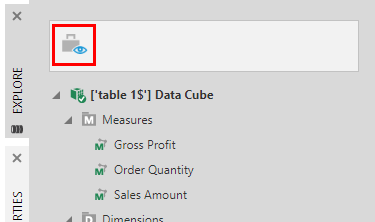
Click the project icon in the Explore window toolbar to view the current project if it currently displays only your new cube.
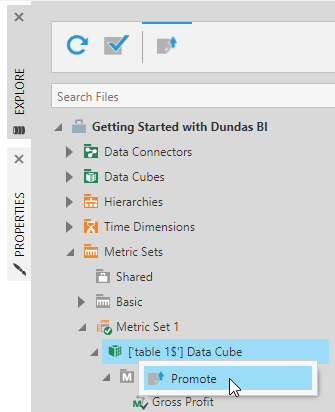
Expand your metric set under the project's Metric Sets folder in the Explore window to find the data cube. You can right-click this cube to Promote it.
Follow steps just like when promoting a metric set to promote this data cube to the Data Cubes folder. This makes the data cube easier to share and reuse, or you can then edit the data cube to transform your data or use other data cube options.
When dragging data onto a metric set directly from multiple data connectors, they are automatically joined within the auto-generated data cube based on relationships, using a Join transform. If you promote this data cube afterward, you can see and edit this join as shown in the article Add a relationship between tables.

