Displaying top/bottom records
1. Overview
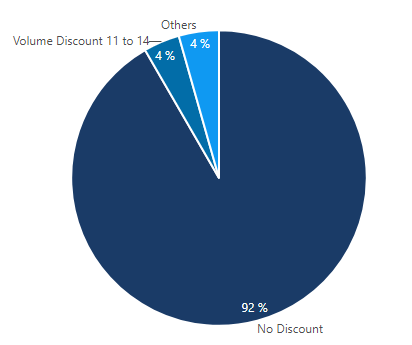
You can filter your metric set to display the top or bottom 'N' number of items, or group the smallest or largest items together into an 'other' group (with a customizable caption). Any other filters are applied first before filtering or grouping the top/bottom items.
For example, you can decide to display only the top 5 values, or only the top 4 values plus an Other value that groups and aggregates all the smaller values together.
2. Set the top / bottom measure
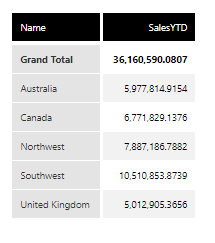
If you want to limit or filter your result to a certain number of items based on a measure's values, you can set up a top/bottom measure.
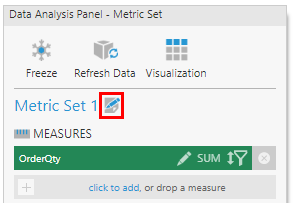
In the Data Analysis Panel, click the Edit icon.
Set Top / Bottom Measure to the measure you want to determine the top or bottom records.
Set Top and/or Bottom to the number of top or bottom items or values you want to display.
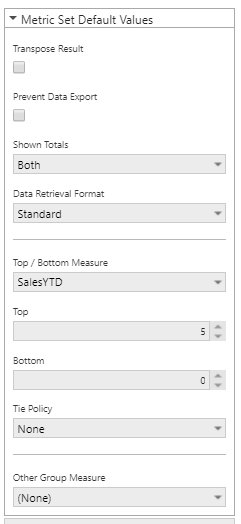
Items with the same value are "tied". You can decide how to handle these values:
- Select Exclude Ties to display exactly the number of items you set, even if some values are tied.
- Select Include All Ties to display all of the items with the top/bottom 'N' values, e.g., the top three values, even if there are four items because two items are tied.
- Select Include All Ties In Last Position to display only the number of items you set, plus any other items with the same value as the last item.
Click the submit button at the bottom of the dialog to apply the settings.
3. Set the other group measure
You can set up an 'other' group to group multiple rows, columns, or data points together into one if their measure value meets certain criteria. This can be set up together with a top/bottom measure as described above, or on its own.
In the Data Analysis Panel, click the Edit icon.
Set Other Group Measure to the values you want to determine the items to group together.
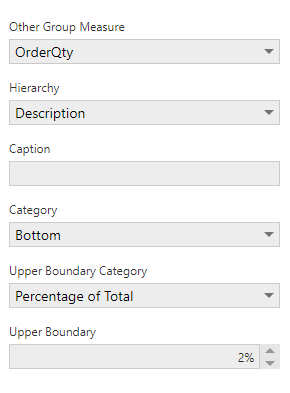
In case there are multiple hierarchies in your metric set, set Hierarchy to whichever displayed hierarchy's values should be grouped together into one.
Set Caption to whatever the new group should be called, e.g., Other.
Set Category to determine if the smallest (Bottom), largest (Top), or values closest to the middle should be grouped together.
Upper/Lower Boundary Category allows you to choose whether to group items together based on:
- Items with values above or below a Fixed Value
- The items with values within the top or bottom Percentage of Total
- A specified Number of Items
Click the submit button at the bottom of the dialog to apply the settings.