1. Overview
This article shows an example of how to use a stored procedure in a data cube with a parameter for selecting the top 'N' records and grouping the rest as 'Others' for a SQL data source.
2. Set up the data
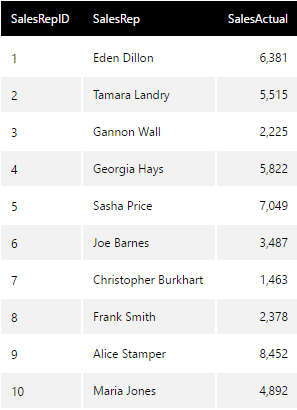
The data in this example is a SQL relational database, with the goal of showing the Top 'N' Sales using a Single Number filter on the dashboard to determine the number, with the rest of the values summed as a single Others item.
2.1. Create Stored Procedure
Create a new stored procedure on the relational SQL data source with a parameter which receives the number of top records we want to display. A stored procedure for the sample data above can be created like below:
create procedure [dbo].[sp_TopNPlusOther]
     @topn int
as
begin
select [SalesRep], [SalesActual]
from (
       select top (@topn) [SalesRep], sum([SalesActual]) as [SalesActual]
       from [dbo].[myTable]
       group by
       [SalesRep]
       order by [SalesActual] desc
) as alias
union all
select '(OTHER)', sum([SalesActual])
from [dbo].[myTable]
where
[SalesRep] not in (
              select top (@topn) [SalesRep]
              from [dbo].[myTable]
              group by
              [SalesRep]
              order by SUM([SalesActual]) desc
)
end
Run the query to save this Stored Procedure.
3. Create a data cube
After creating a new data connector to the database with the above created stored procedure, create a new data cube.
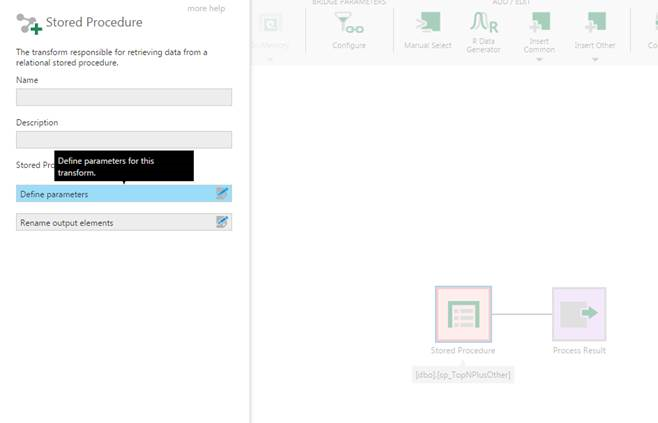
Drag and drop the stored procedure sp_TopNPlusOther onto the data cube canvas.
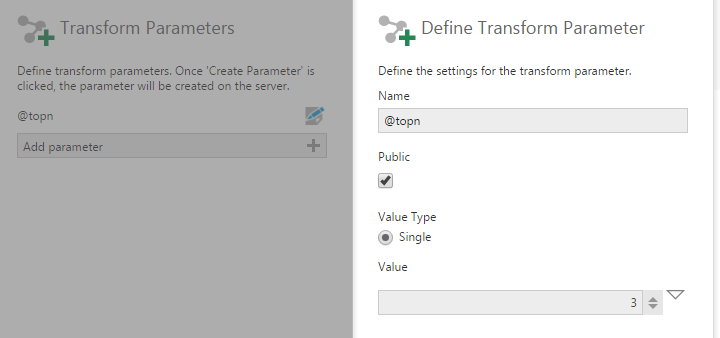
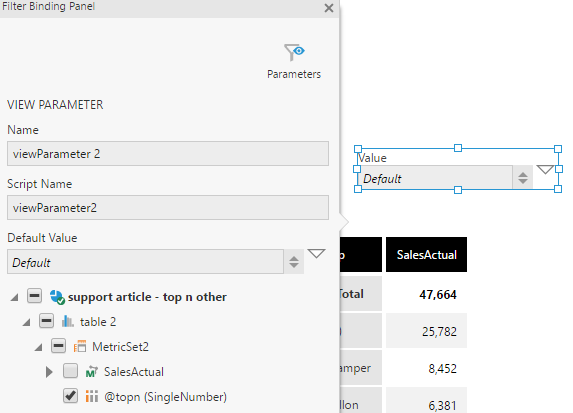
Double click the stored procedure transform, then click Define Parameters.
Select the @topn parameter defined in the stored procedure.
- Set the Parameter to Public to allow it be set from a dashboard
- Set the default Value to 3
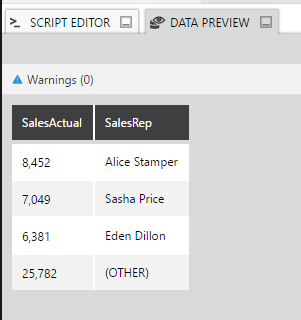
Preview the data from the process result.
Check in the data cube.
4. Using the data cube on the dashboard
On an existing or new dashboard, drag and drop the above created data cube.
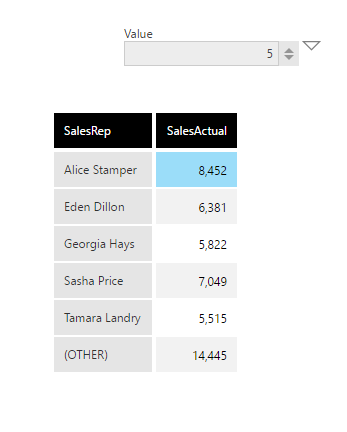
Choose Filters in the toolbar, then select a Single Number filter.
Connect the Single Number filter to the @topn parameter under the table.
By default, the table will show top 3 Sales and the sum of the rest of the Sales. Switch to View mode and change the value in the Single Number filter to change the number of top Sales that are visible.