
1. Overview
The Word Cloud (also known as Tag Cloud) data visualization displays text with color and size emphasis based on measures.
2. Data preparation
To follow the examples in this article, connect to the Adventure Works sample database for SQL Server. Locate the following dimension from the [Person].[Person] table:
- FirstName
And the following measures from the [Sales].[SalesPerson] table:
- SalesYTD
- Bonus
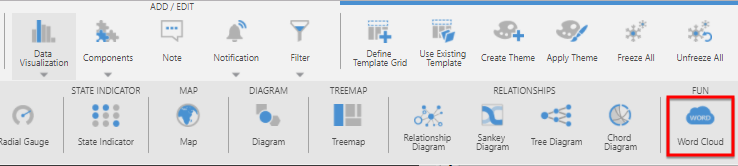
3. Add a word cloud visualization
While editing a dashboard, use the Data Visualization option from the toolbar and select Word Cloud.
Drag FirstName and drop it under Rows in the Data Analysis Panel.
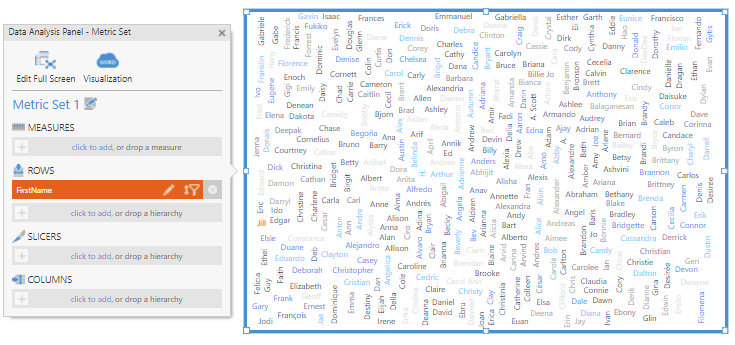
The visualization is displayed as a jumble of all the names in the FirstName dimension.
Drag SalesYTD and drop it under Measures.
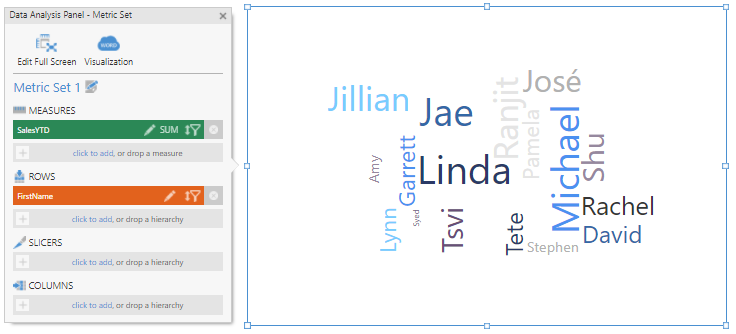
The salespeople names are automatically re-sized according to their year-to-date sales.
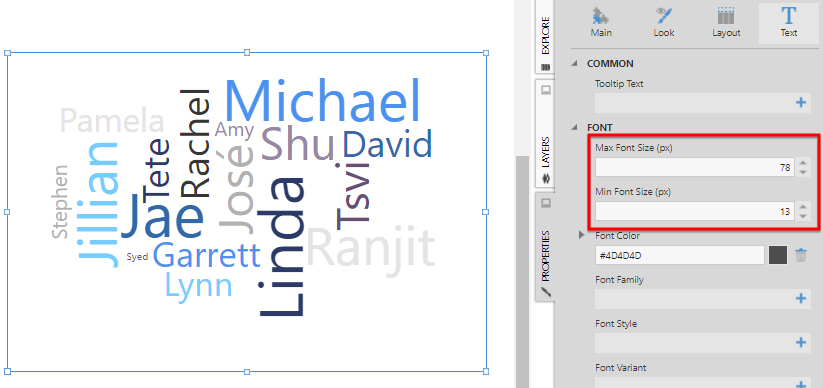
You can adjust the range of text sizing by changing the minimum and maximum font size properties.
4. Change the text color
Select Visualization in the Data Analysis Panel.
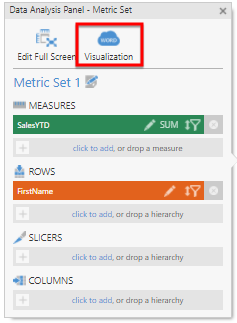
Drag the Bonus measure and drop it under Text Color.
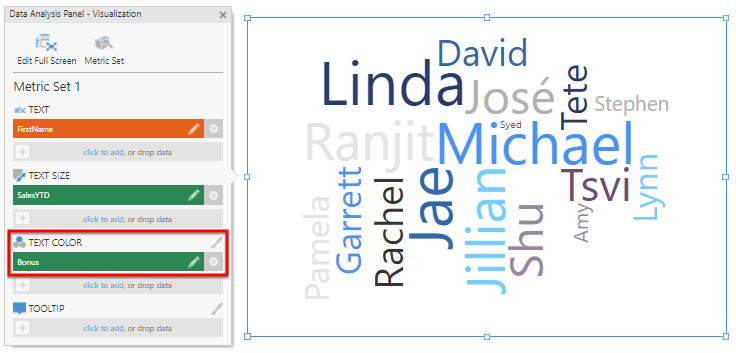
The color of each name is now defined by its Bonus amount. You can further adjust the color scheme in the Properties window by customizing the color rules in the Design (or Look) tab.
5. Adjust the text layout
In the Properties window, switch to the Design tab and expand Layout & Spacing (formerly the Layout tab).
Adjust the Text Padding and Maximum Rotations properties to best match your data.