Notes (annotations)
1. Overview
A note (or annotation) is a comment that is attached to a data point and displayed on a data visualization. You can use notes to provide more context, or to communicate with other users viewing the same data, including replies.
Since a note is associated with data, the same note will automatically appear on other visualizations or views that are displaying the same data point.
Related video: Notes
2. Add a note to a data point
All users with the Note privilege can add and reply to notes on a dashboard or on any other view that they have access to.
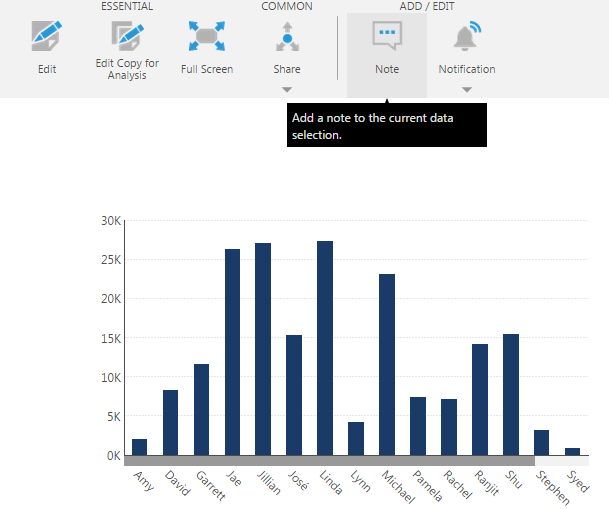
If the toolbar is displayed at the top of the screen, click Note on the toolbar. Or, right-click (or long-tap) a data point and choose Add Note.
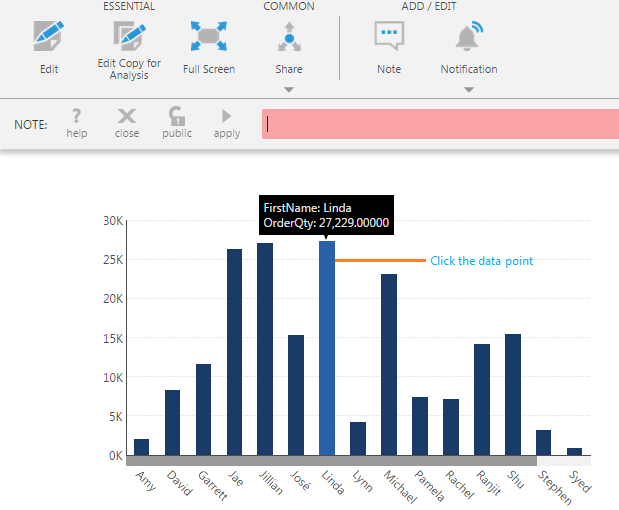
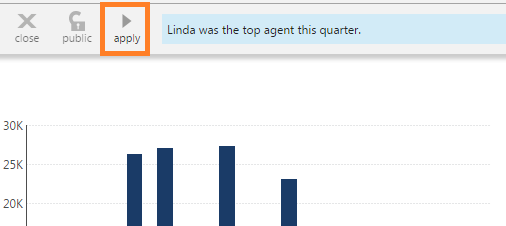
The note bar appears below the main toolbar. This is where you can enter your note.
If you used the toolbar to add a note, the textbox will initially be red because you still need to choose a data point. On the visualization, click the data that you want to attach the note to.
You can choose whether you want the note to be public (for everyone), private (only for you), or have custom permissions, by clicking the public/private/custom toggle button to rotate between these options.

Click apply.
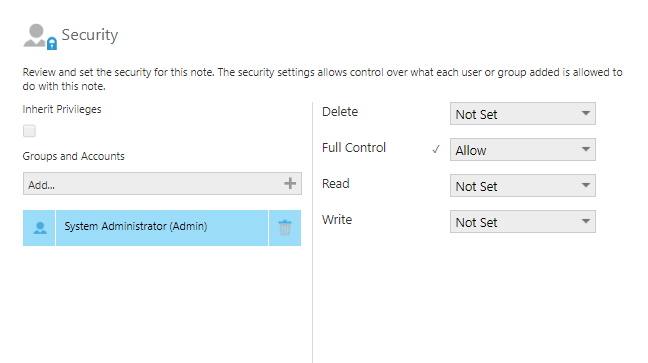
If you chose custom permissions, the Security dialog will appear next. For details, see the section on editing security permissions.
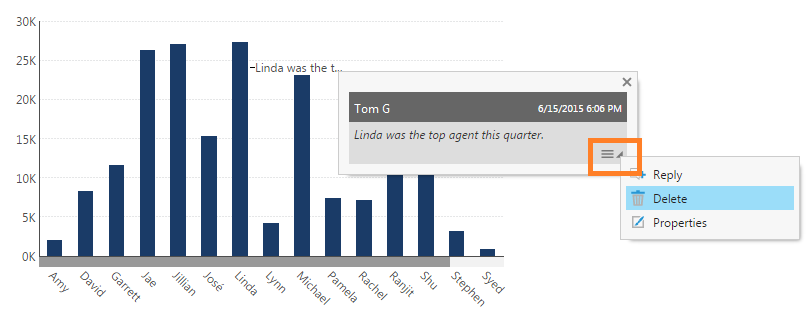
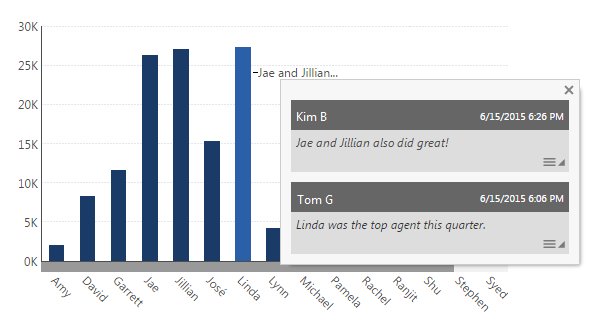
The note appears next to the data point and can be viewed, edited or deleted based on the security permissions specified. Hover over the note to see its details in a popup.
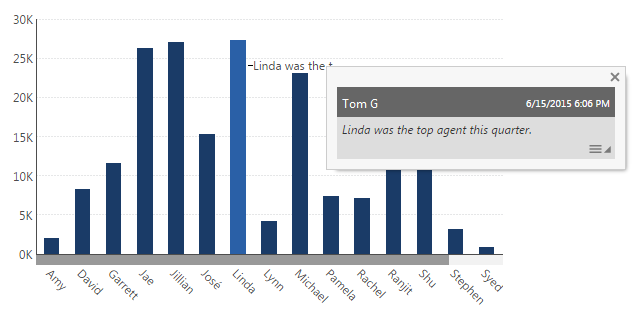
Notes are attached to this particular data in the data cube source itself, and will follow it when the data point moves when filtering or sorting, when a different visualization is used, or when another metric set using the same data cube displays this data point.
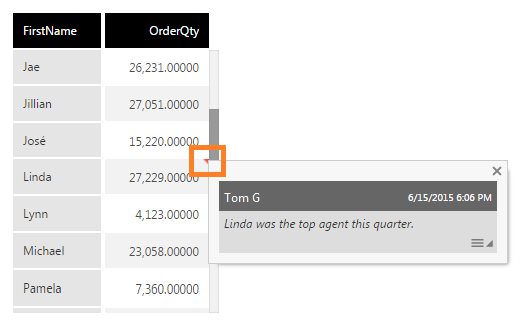
To demonstrate, right-click the chart and click Re-Visualize, then Table. Scroll down and you'll see a corresponding table cell with a small, red triangle in the top-right corner. Hover over the red triangle to see the same details of the note.
3. Delete a note
To delete a note, hover over it to open the popup with note details. Click the menu button in the bottom right corner, and choose Delete.
4. Reply to a note
Other users who have permissions to view the same dashboard can also reply to an existing note.
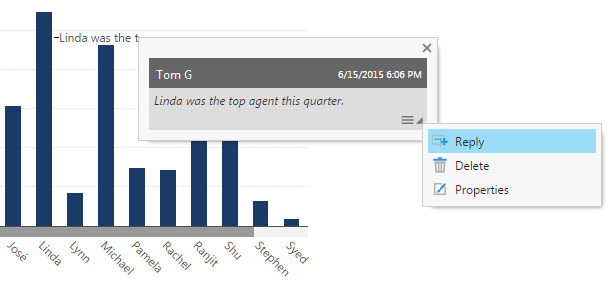
For example, as a different user, hover over an existing note to open its details in a popup. Click the menu button in the bottom right corner, then click Reply.
The note bar appears below the main toolbar. Enter the reply text, and then click apply.
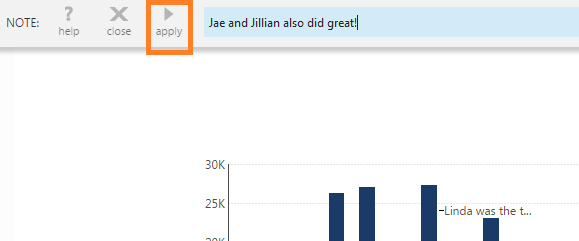
The note appearing beside the data point is updated to show the reply text. Hover over this text to see the Note window which shows all of the notes and replies. The most recent ones appear first in the window.
5. Edit security permissions
To edit the security permissions after adding the note, hover over the note to open its details in a popup.
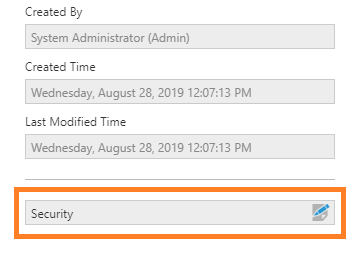
Click the menu button in the bottom right corner, click Properties, then click Security at the bottom of the Properties dialog.
The Security dialog displays a list of accounts and groups that you can edit. Click each one to assign its permissions, then click the Save button at the bottom when finished.
For more information about assigning security permissions, see the File and folder properties article.
6. Notifications
You can be notified when someone adds a note to a metric set if you're expecting someone to add one or reply to one of yours. See Notifications (alerts) for details.
7. Notes
- The data point a note is attached to is identified by all of its hierarchy and filter/parameter values, including parameters in the underlying data cube. Notes cannot be added to a visualization set to display raw data in its metric set because these identifying values are not unique when aggregations are disabled.
- Filtering a data cube parameter by account attribute or custom attribute can prevent the same note from being seen by different users even when they seem to be viewing the same data point. To allow these notes to be shared when appropriate, use a security hierarchy for row-level security instead.
- Dynamic measures do not support the displaying or adding of annotations.
- Annotations cannot be added to metric sets where the hierarchy values come from a function, such as a histogram formula.

