Use a button to apply a filter value
1. Overview
This article shows you how to set up a filter interaction on a component such as a button, which will filter a visualization when clicked.
The following example uses a button, but other non-data components such as labels can be set up the same way.
2. Create a new dashboard
As an example, create a new dashboard using the Blank template.
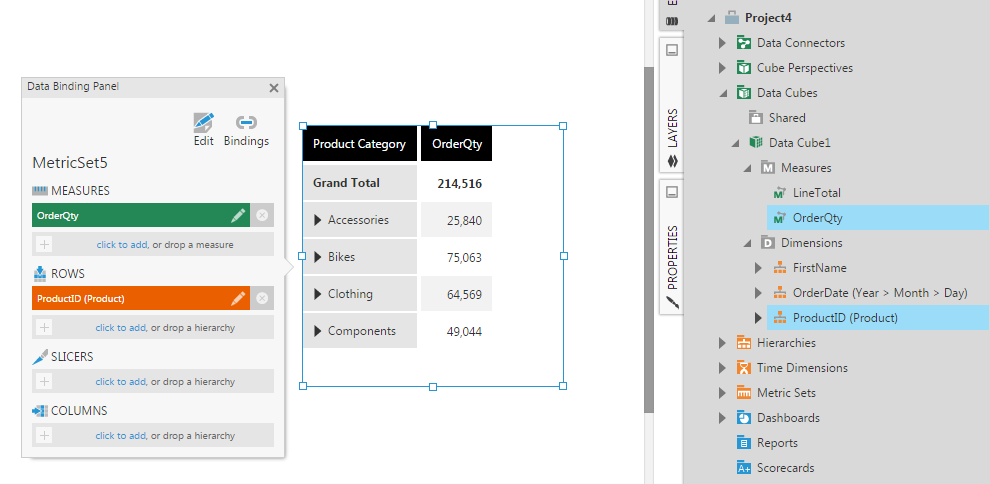
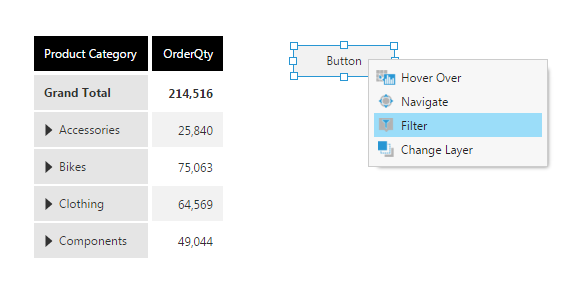
Drag a measure (OrderQty) and row hierarchy (Product) from a data cube to the dashboard canvas. You'll see a table visualization like the one below.
3. Add a view parameter
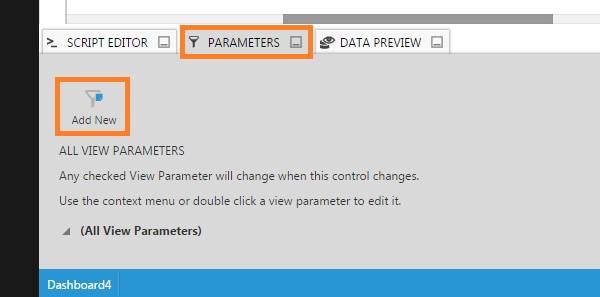
Go to the bottom of the dashboard editor and click to open the Parameters window.
In our case, we will click Add New to add a view parameter for this visualization. You can skip this step if you already have one from another interaction or a filter that you want to use.
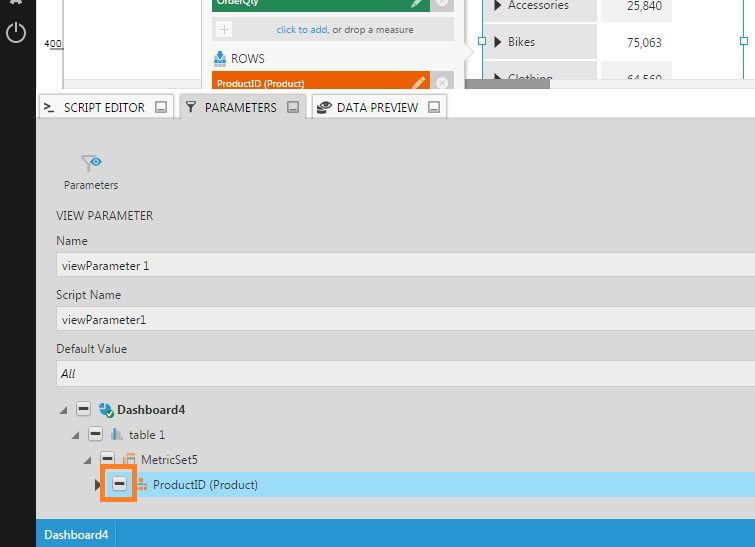
We will connect the new view parameter to the Product hierarchy in our table visualization. You can give it a descriptive Name.
4. Add a button component and set up filter interaction
Click Components in the toolbar, and in this example, we will select to add a Button to filter our Product data to a particular value.
In the toolbar or right-click menu for the button, click Set Up Interactions, then click Filter.
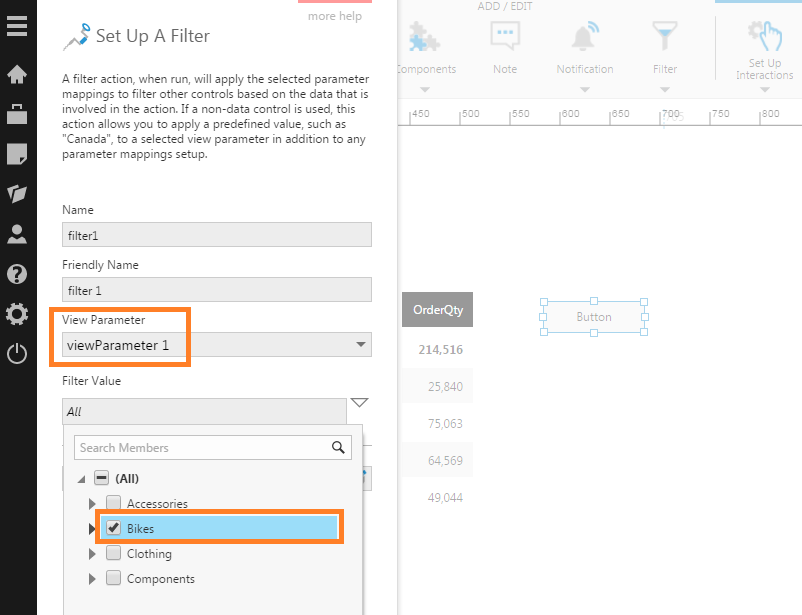
In the filter setup dialog, set the View Parameter to the view parameter you want to change on button click.
Under Filter Value, select the specific filter value you want the button to apply.
5. View the dashboard
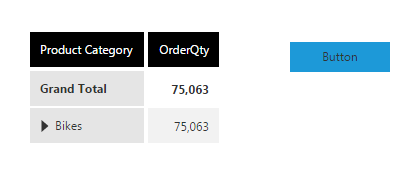
Switch to View mode to test the dashboard. Click the button to see the table visualization filtered to the value you selected during setup.
