1. Overview
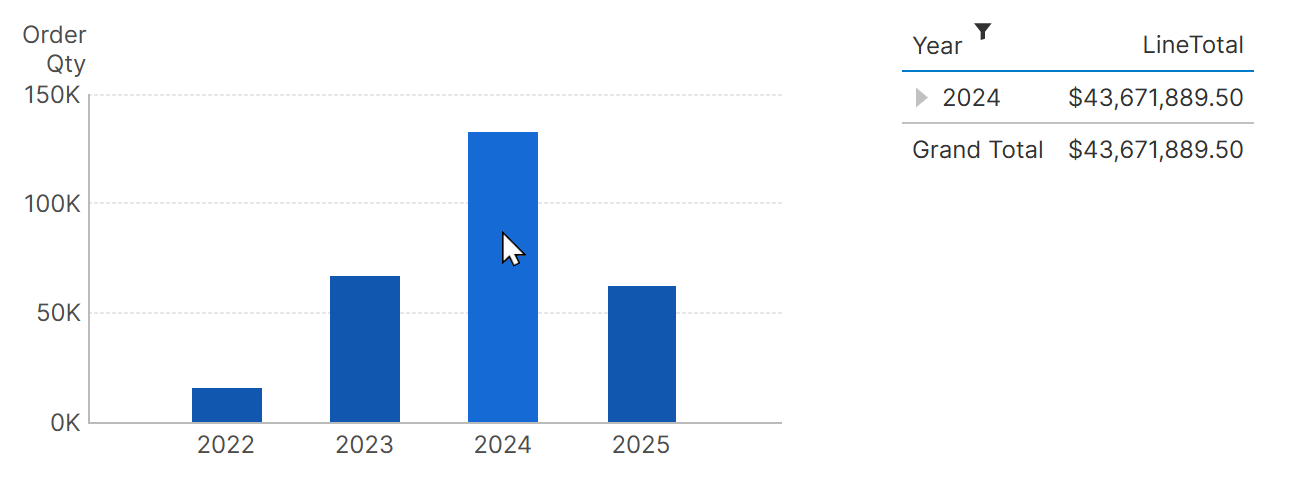
This article shows you how to set up a data visualization with a filter interaction so that when data is clicked or tapped, other visualizations with compatible data can be automatically filtered to the same selection.
You can also edit the parameter mappings to customize what data is passed and where during the interaction. For non-visualization controls such as buttons, you can apply a predefined filter value instead.
Related video: Interactions
2. Example dashboard
As an example, we are visualizing OrderQty by Date on a dashboard as a bar chart.
We have also added a table visualization showing LineTotal by Date.
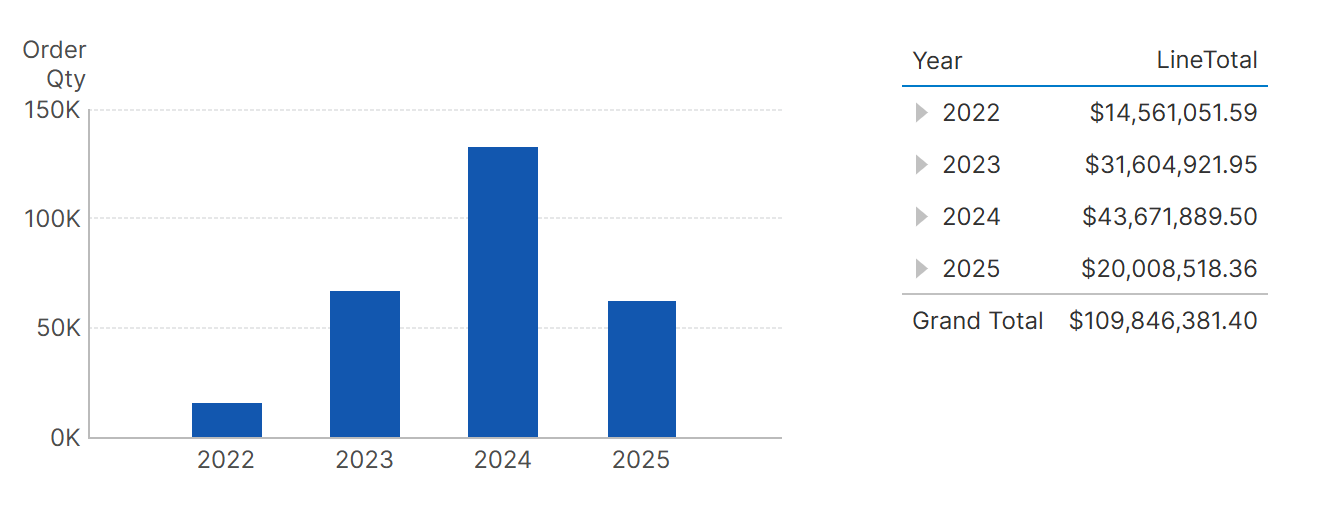
These visualizations are both displaying time hierarchies, which are generally all compatible with each other for filtering. For other kinds of data, you may need to ensure the two visualizations have matching values or hierarchies.
3. Set up the filter interaction
With the bar chart selected, click Set Up Interactions in the toolbar or right-click menu, then Filter.
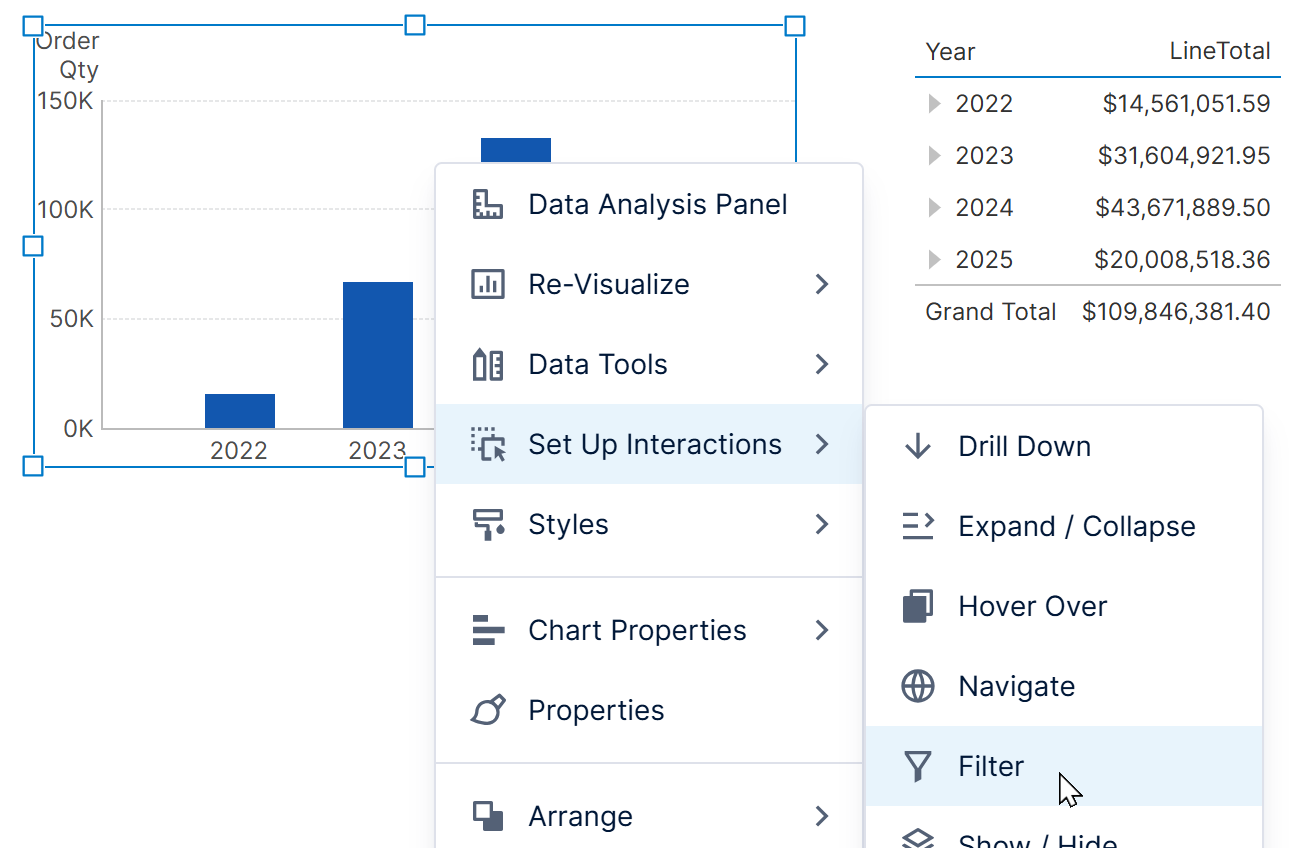
The filter interaction dialog is displayed, with settings filled in automatically for you based on compatible data added to the Data Analysis Panel for visualizations on the dashboard.
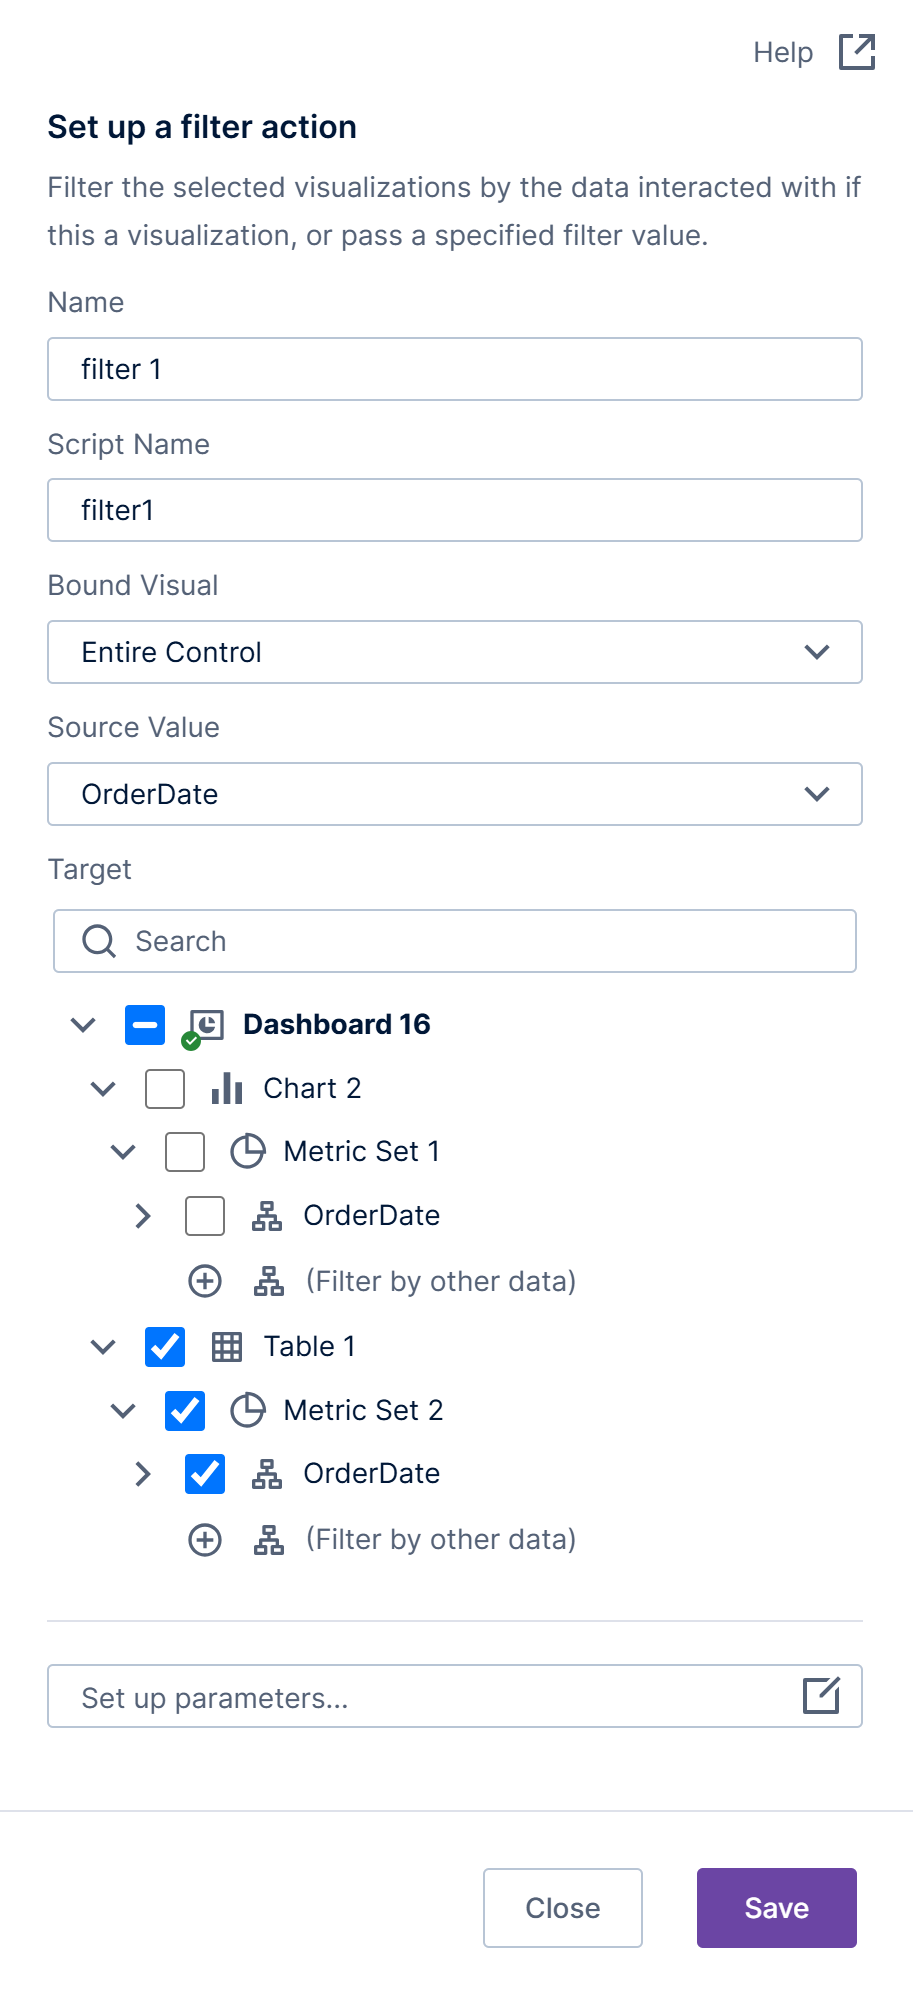
You may want to enter a descriptive Name if you plan to add more interactions.
In version 26.3 and higher, you can immediately see and change what data will be passed from the source visualization and what the target visualizations are:
- The Source Value dropdown for a new filter interaction lets you select what value from the source visualization to use for filtering (e.g., OrderDate).
- Under Target, use the checkboxes to select which visualizations with matching data should be filtered by the source value (e.g., the table visualization's OrderDate), similar to connecting a filter. Hover over an item to see it highlighted on the canvas behind the dialog.
- If data matching the source value isn't already listed under another visualization that you want to filter, you can click (Filter by other data) and then choose matching data from a list of other data from its data source. This will add that data to Slicers in its metric set for you automatically.
In many cases you can leave the default settings as they are. For more advanced interactions such as passing data from a visualization to the Brush View Parameter instead of filtering data, you can click to Set up parameters, described in more detail in the next section.
Once finished, click to Save at the bottom of the dialog. You can now test the filter interaction as shown later, or take a look at how this interaction works as shown next.
3.1. Examining the setup
Click to open the Parameters window, which is docked on the bottom by default.
Look for a filter view parameter and expand it. This view parameter was automatically generated by the filter interaction dialog and connected to the OrderDate hierarchy on the table visualization in our example.
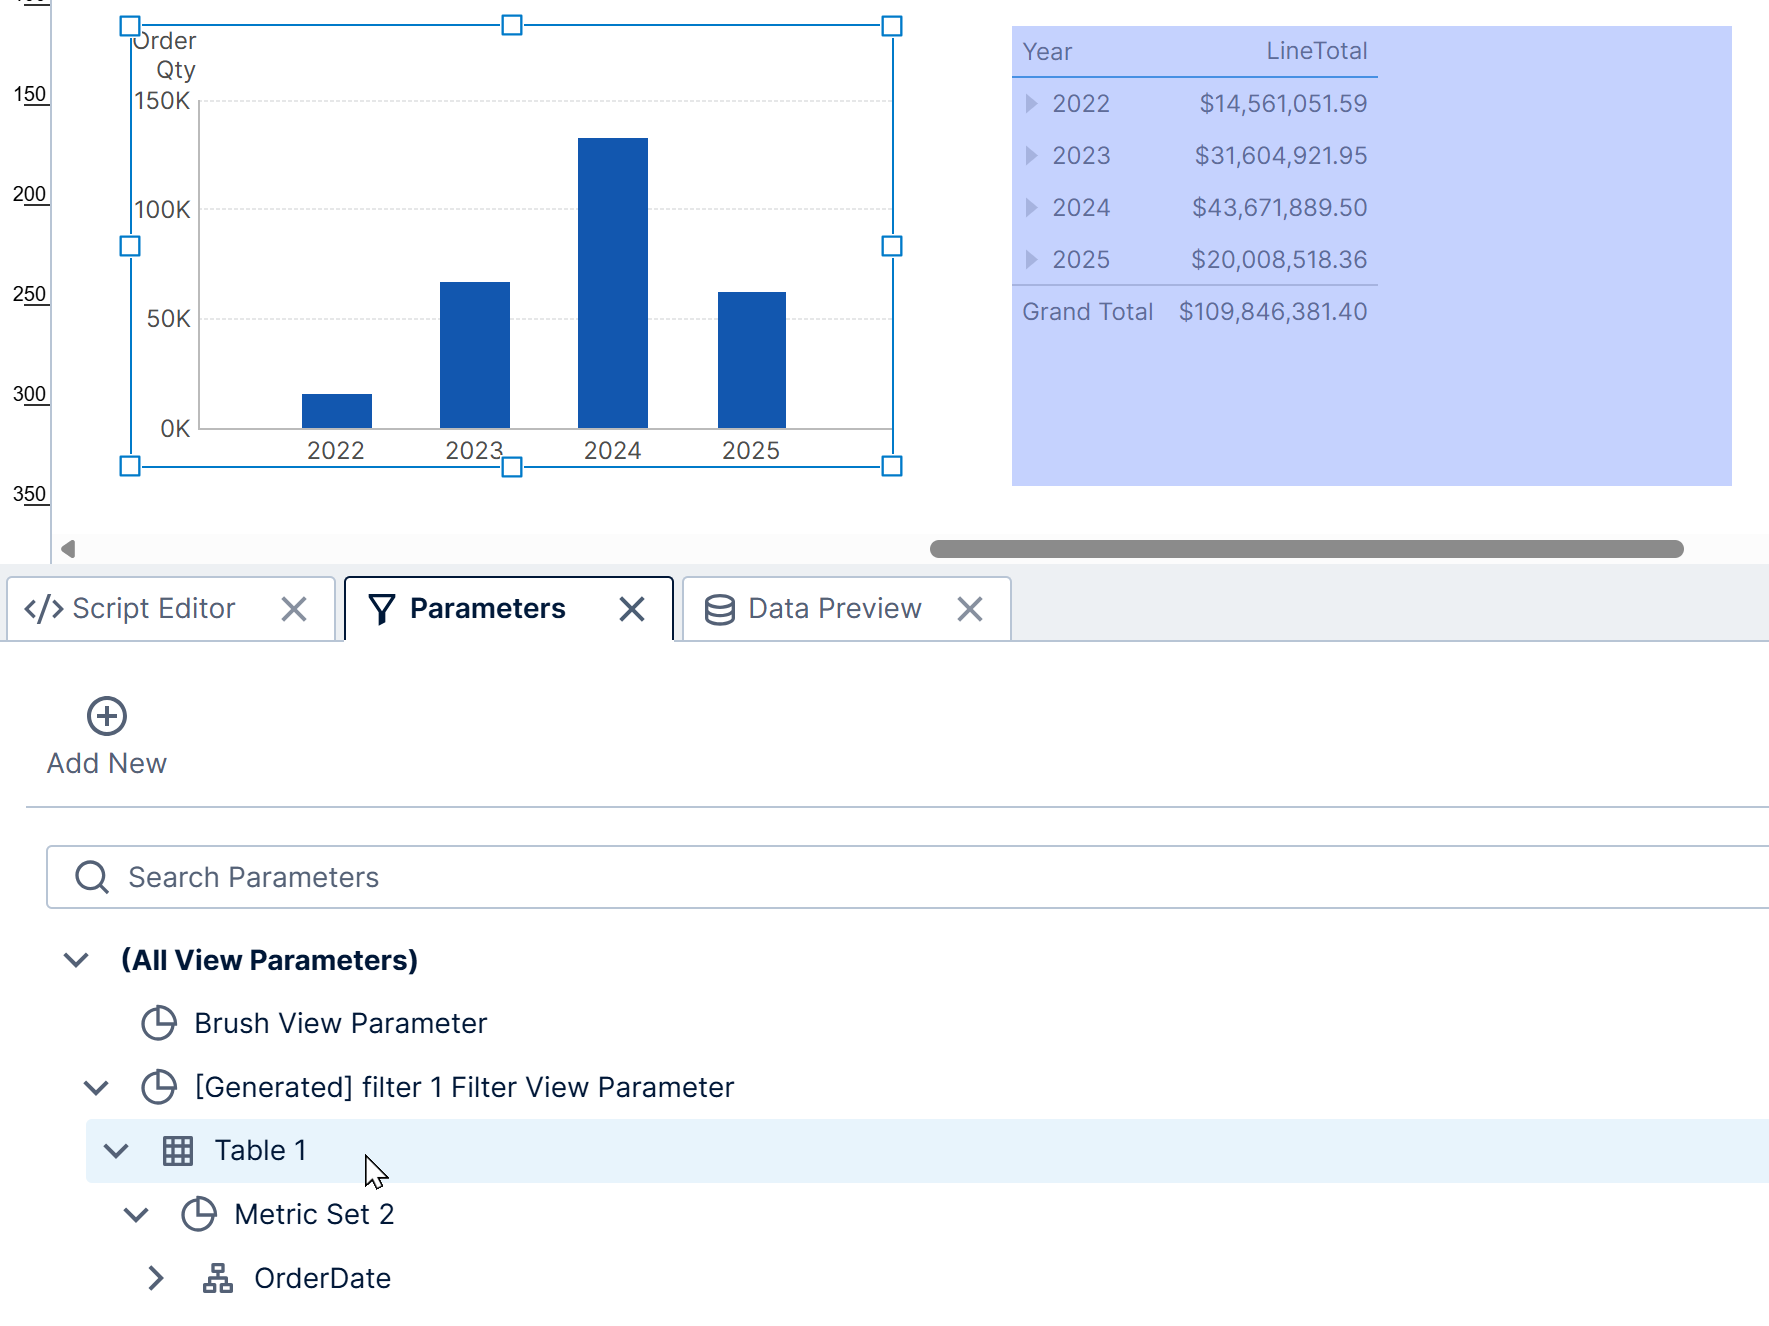
You could select the view parameter and click Edit if you wanted to change the target visualizations from here, or you can reopen the filter interaction dialog to do this.
Next, reopen the filter interaction dialog, click Set up parameters, then click the parameter mapping that was created for you automatically to see its details.
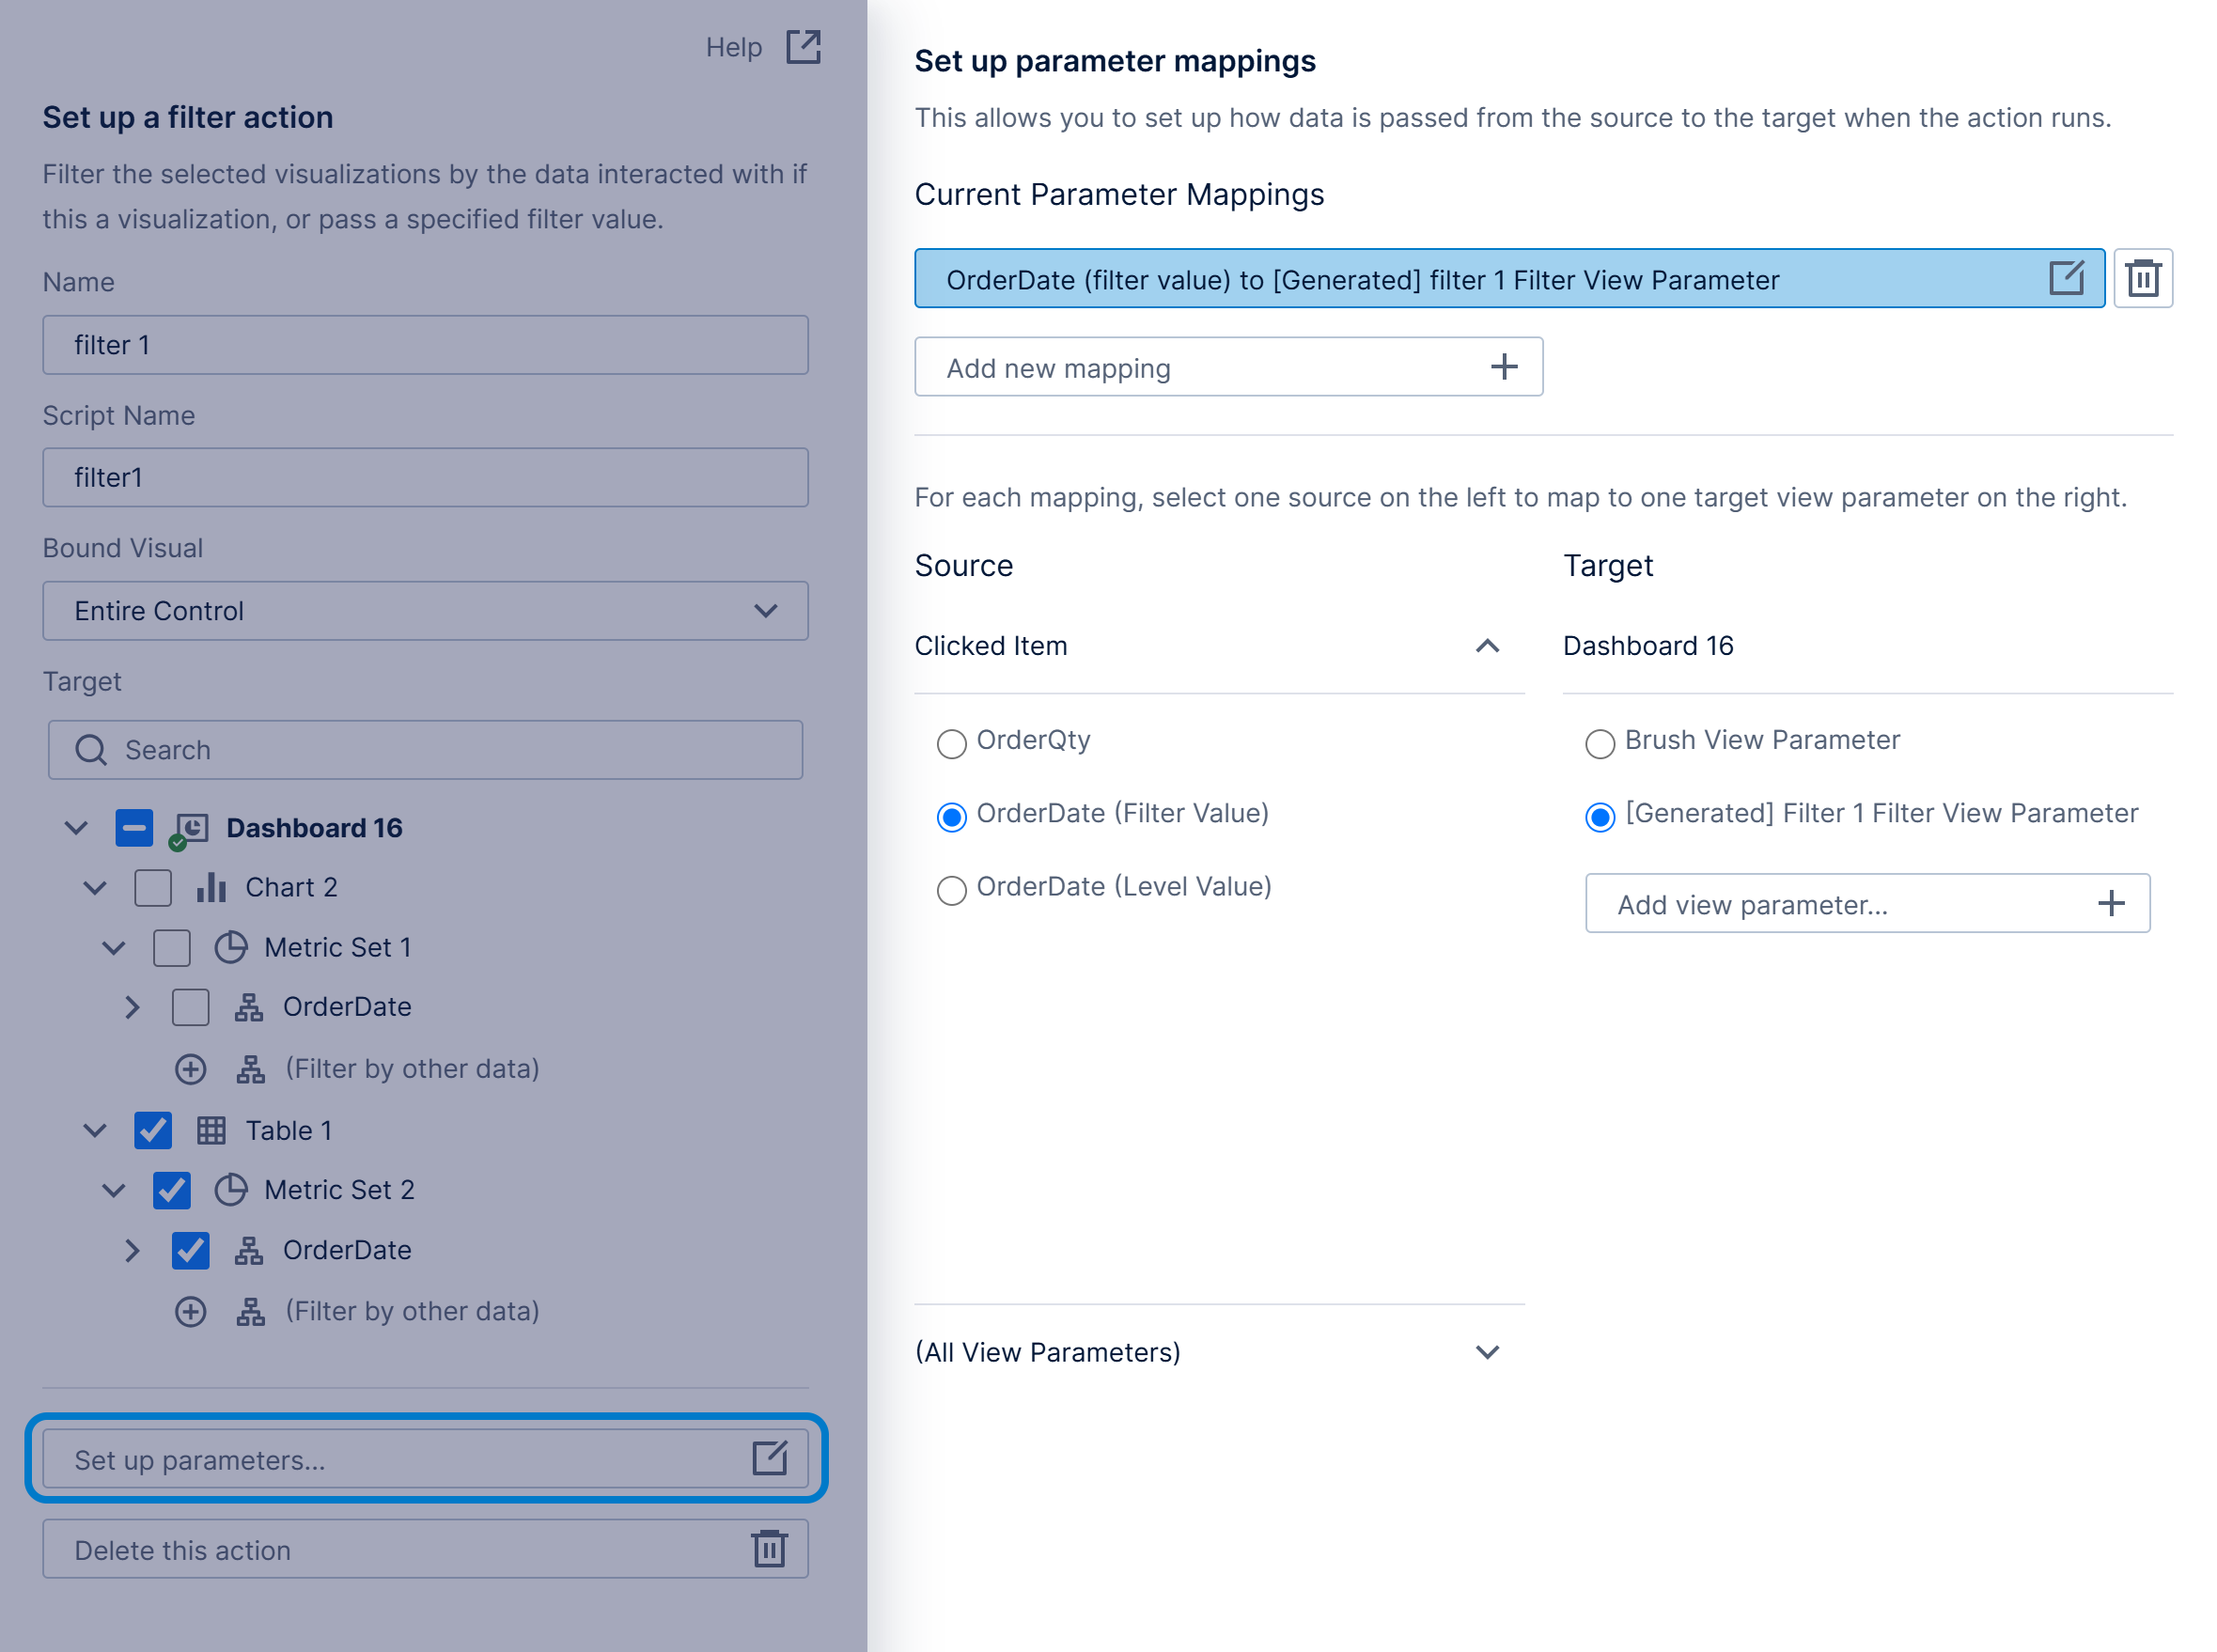
- Under Source, OrderDate (Filter Value) is selected so that when a data point is clicked on the bar chart, its order date will be passed to the generated view parameter under Target that we just looked at above. This dialog allows you to change the source value of the interaction.
- Under Target, if you have already created a view parameter connected to some target visualizations in the Parameters window or for a filter, you could choose it instead here as an alternative to allowing one to be automatically generated for you. You can also target the Brush View Parameter for custom data brushing.
4. Test the interaction
Exiting out of any dialogs, switch to View mode in the toolbar and click a data point on the bar chart.
You should see the table visualization filtered to the same time value.