
1. Overview
Filters can be added to your dashboard, report, or other view to allow you to easily see and change the current filtering while viewing. All user types can add filters when editing, and can connect them to multiple visualizations to filter them at the same time.
There are a variety of filter types available for different types of data, offering different ways to interact with the filters. When using a dashboard, you can also arrange the filters wherever you like on the canvas.
Related video: Filters
2. Types of filters
Filters can be added to filter the data directly by some values, or to filter in other ways:
- Hierarchy & string values: All non-numeric data becomes a hierarchy when selected in a metric set. Data cubes and formulas may also have string (text) parameters that you can connect to.
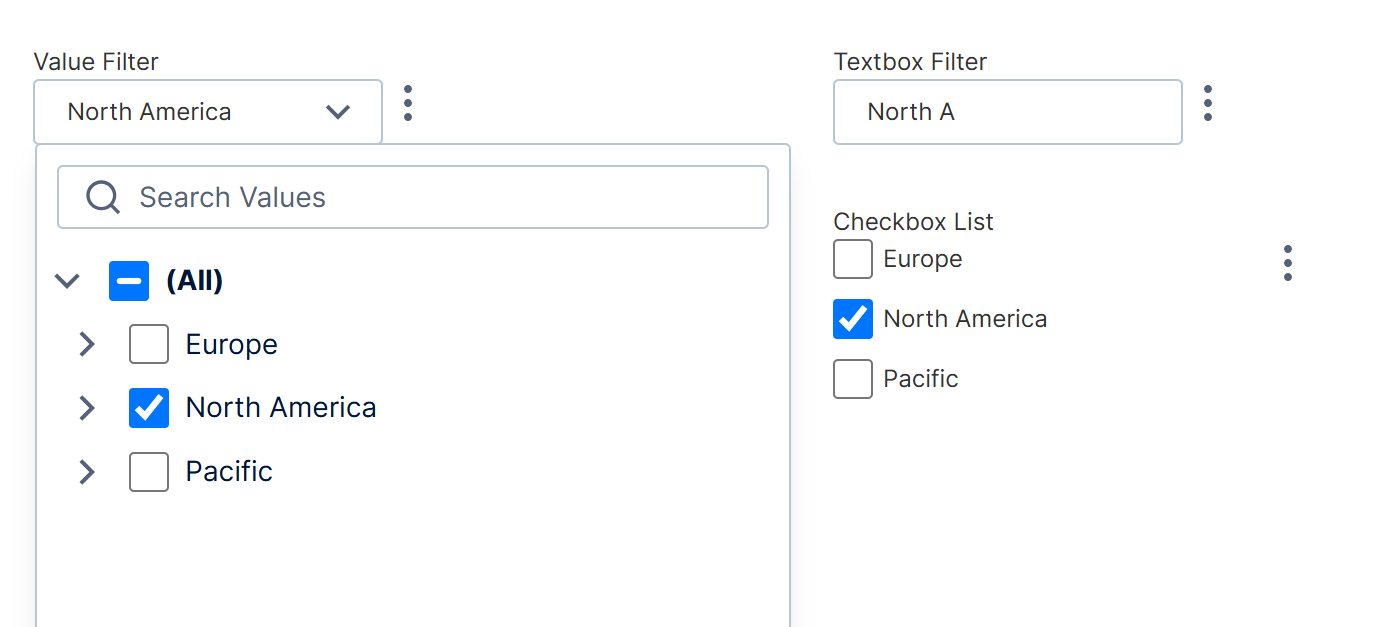
Hierarchy value filter examples - Date values: Calendar, date/time, and the play axis filter are available for dates and time hierarchies. Calendar filters integrate with time dimensions to offer more capabilities than regular date/time filters.
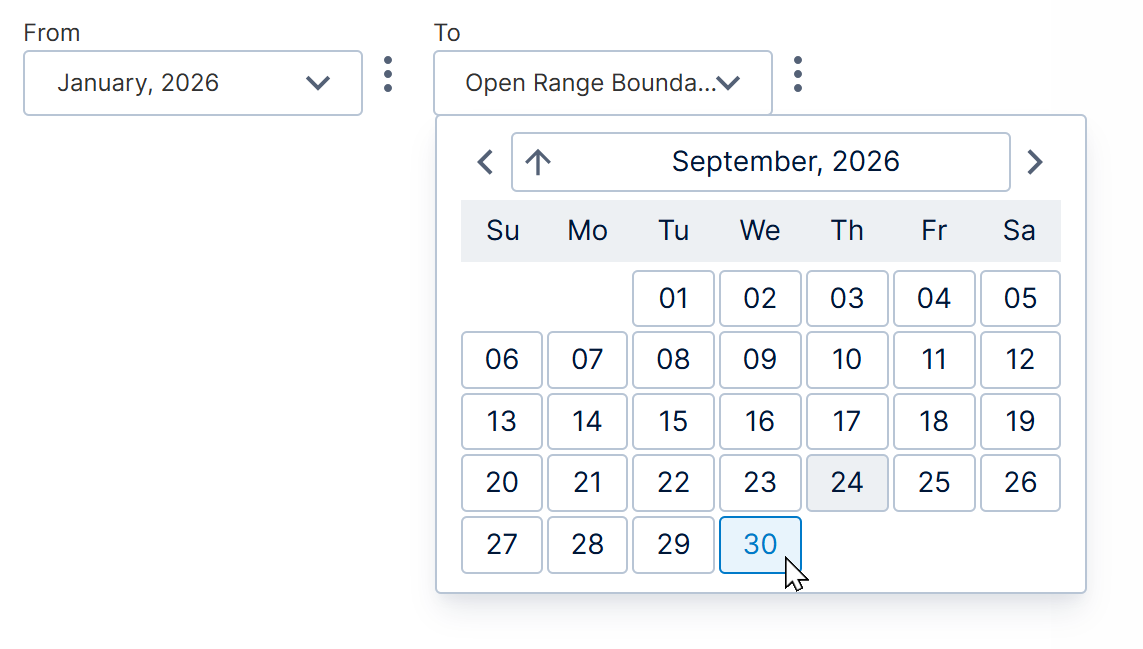
Calendar Range filter - Numeric values: You can filter numeric data by inputting a number or range, or using a slider.
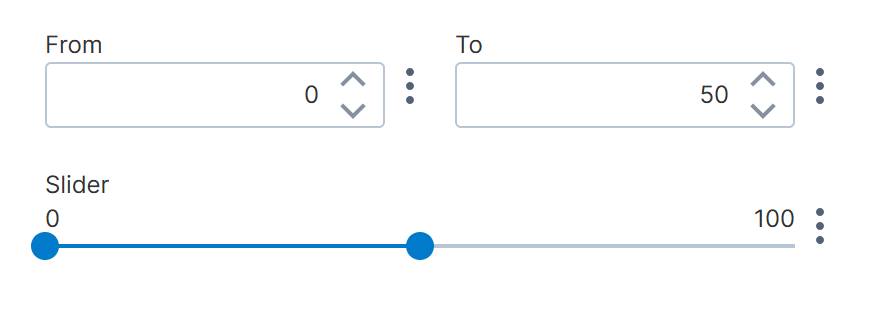
Numeric filter examples - Boolean (True/False) values: A checkbox filter can filter by Boolean-type parameters from a data cube or formula.
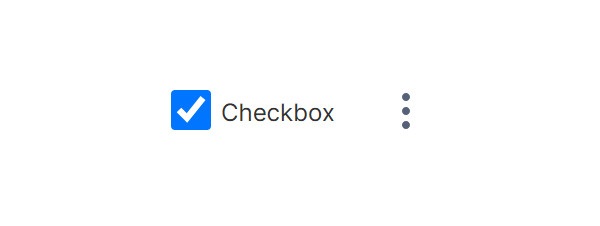
Boolean filter - Hierarchy level: Add a hierarchy level filter to easily switch between levels in a multi-level hierarchy.
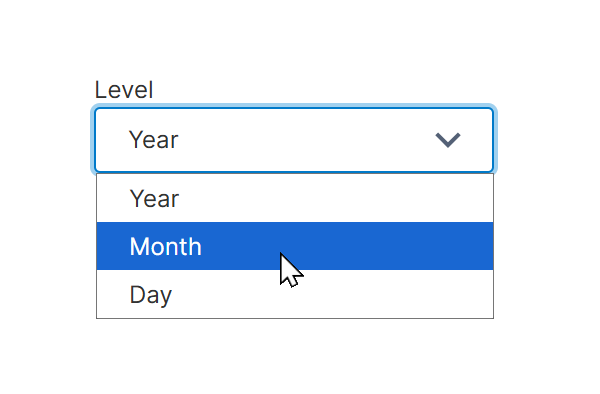
Level filter - Period over period: The Time Lag filter can change which alternate period is displayed alongside your other measure values for comparison, e.g., last year vs. two years ago.
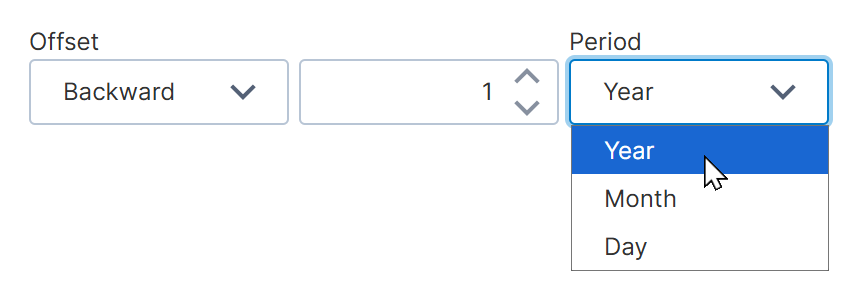
Time Lag filter - Dynamic elements: The Dynamic Element filter can be used if you are using dynamic measures or dynamic hierarchies to switch between different displayed data.
- Update button: Although not a type of filter, you can add an update button connected to other filters to apply all of their filtering at once, only when the user clicks the update button.
3. Adding a filter
Filters can be added when editing a dashboard or other views such as reports.
To automatically add the most common type of filter for your data, select one or more visualizations displaying the data that you want to filter, choose Filter from the toolbar, and then Smart.
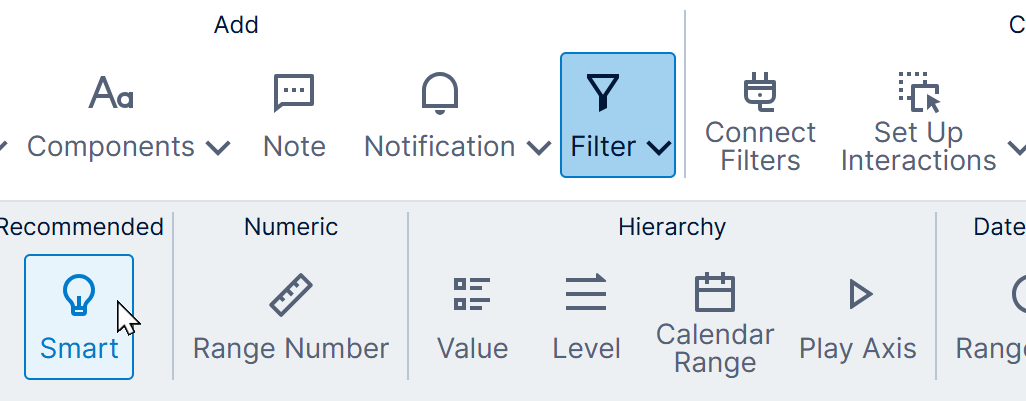
If editing a dashboard, the filter will then be added to the canvas, where you can position it like other content wherever you like. With other types of views such as reports, filters will be added to the parameter bar instead.
If you know what type of filter you want to add, you can choose that instead from the toolbar, or keep choosing the Smart option to add filters for other data and then delete any you don't want.
To interact with a dashboard filter directly, click View (or Sandbox View) in the toolbar. In a report or scorecard, open the filter bar using the Change Filters button in the toolbar as shown in Sorting and filtering a report or scorecard.
4. Connecting filters
When a new filter is added, the Connect Filters popup appears beside it, allowing you to see and change which visualizations will be affected by this filter and by which values. You can connect to more than one visualization if they are displaying values that are compatible, even if they come from different data sources.
If a visualization doesn't yet have data in its Data Analysis Panel matching what you want to filter by, you can click (Filter by other data) in version 26.3 and higher to choose other data in its data source, and it will be added to Slicers in its metric set automatically.
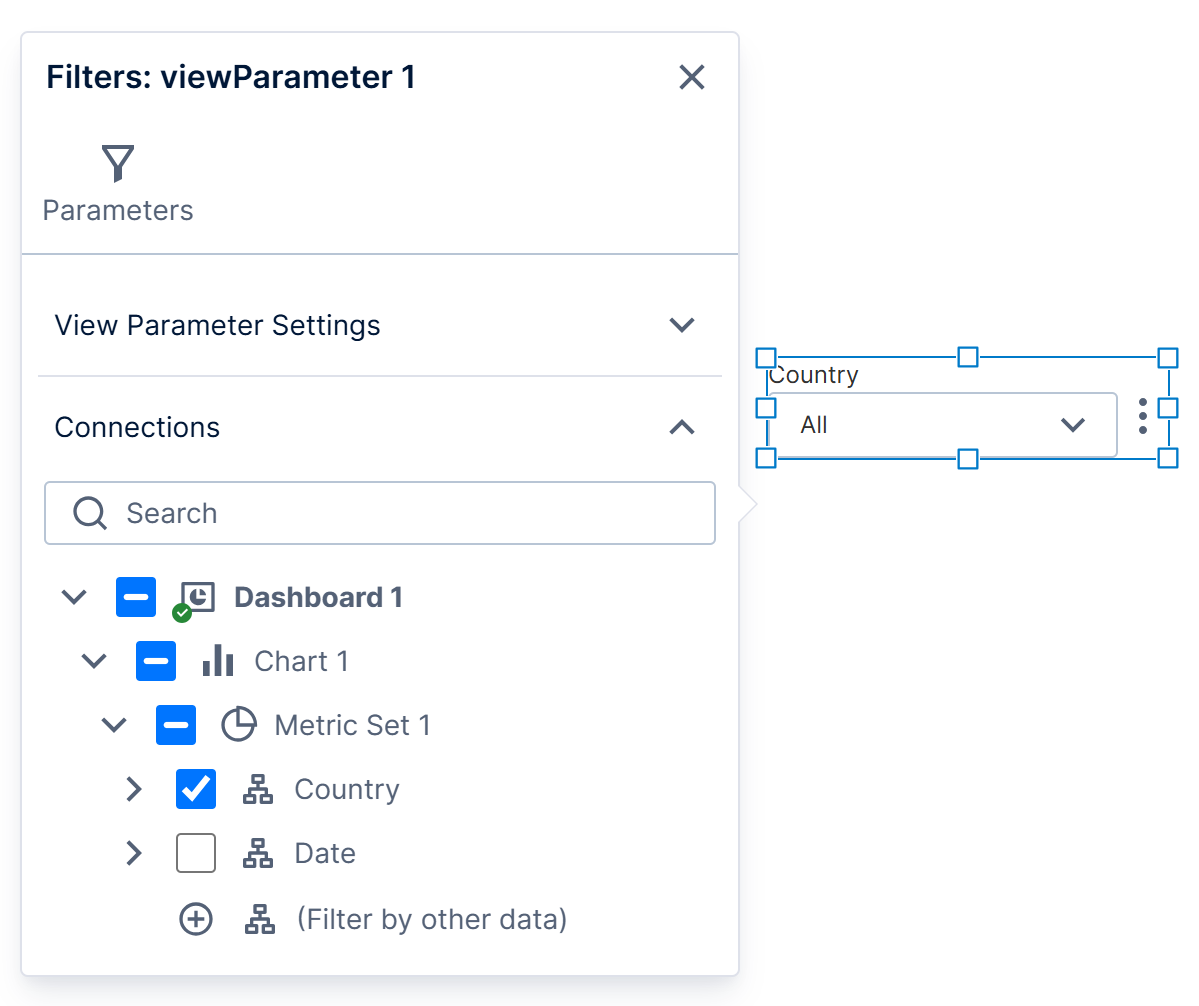
If your data comes from a data cube with parameters that someone made public, or contains formula parameters, these may also be listed for you to connect to if the filter is compatible.
To reopen this popup at any time, select the filter and choose Connect Filters in the toolbar.
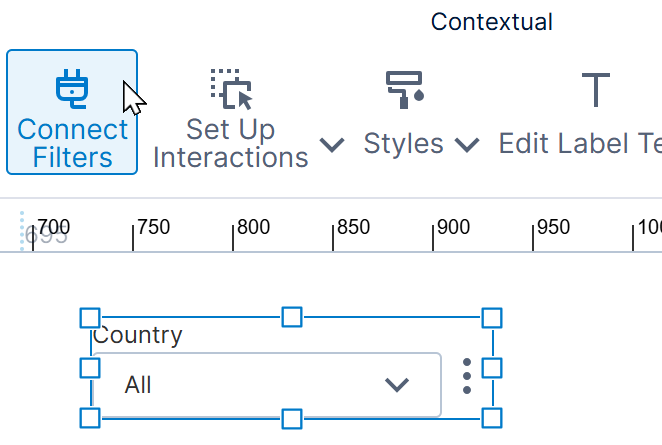
If a visualization was selected when you added the filter, some of its data will be selected automatically. To change it, uncheck it first and then select the other data you want, because some options may be hidden if they have an incompatible data type.
You can set the Default Value for the filter in this popup (expand View Parameter Settings in newer versions), which is the filter setting that will take effect initially for each viewer until they change it.
5. Dependent filters
You can create a dependency between filters if you want one filter to determine what values can be chosen in another filter.
In the Connect Filters popup, click Dependent Filters.
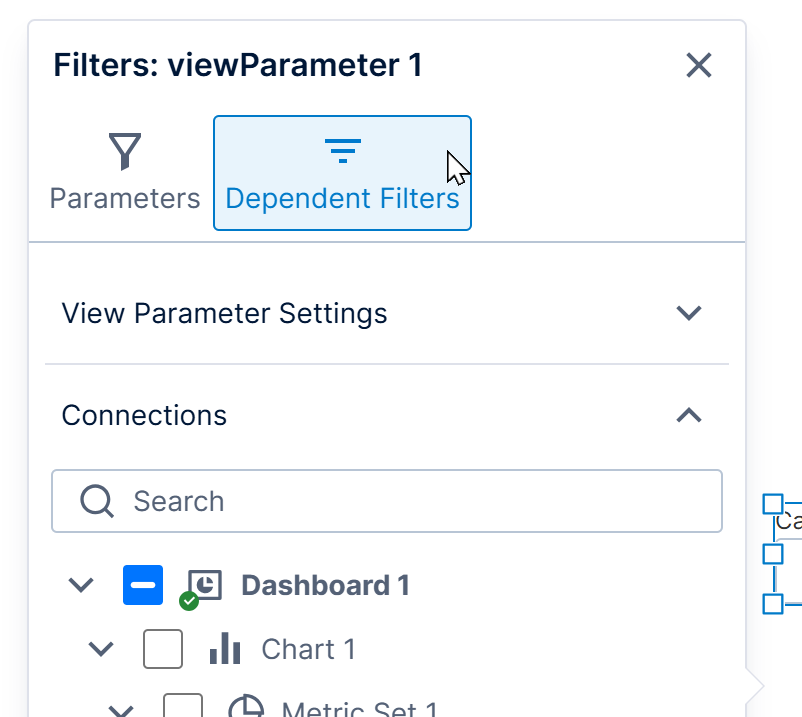
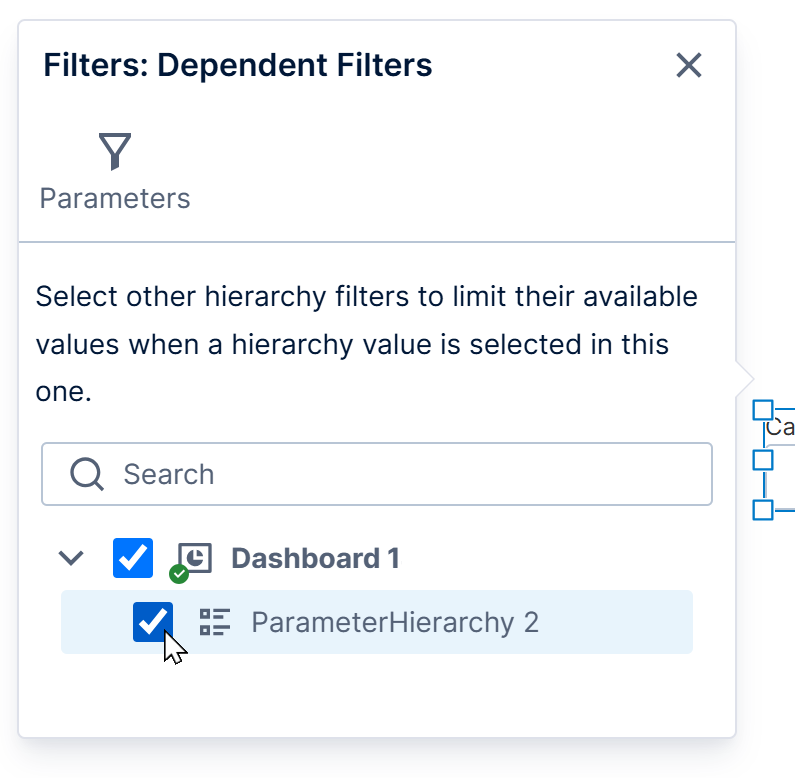
Select the other filter to be 'filtered' by this one.
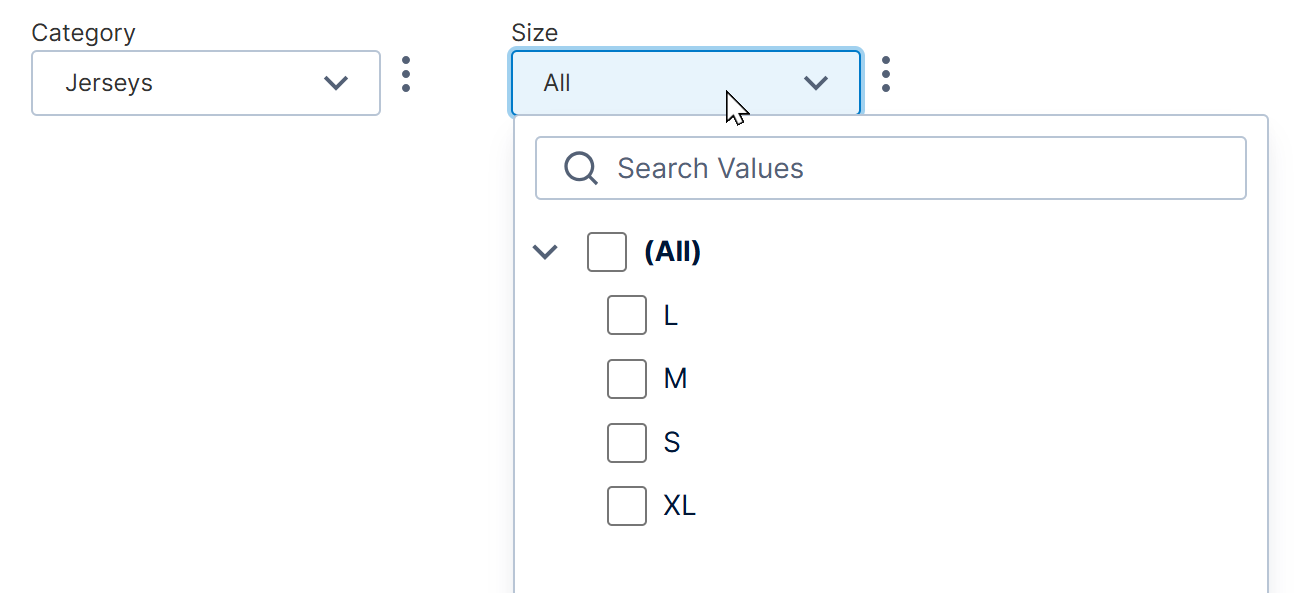
Click View (or Sandbox View) in the toolbar, and change this filter to a subset of the available data. Observe that the dependent filter now offers only a subset of options.
6. Parameters
In the Connect Filters popup, notice that it mentions a view parameter. View parameters can filter visualizations on your dashboard or other view by passing filter values to the metric sets and data cubes powering those visualizations.
A view parameter is created automatically for the filter when you add it, and is opened for editing automatically in the Connect Filters popup so that you can connect it. You can also find this parameter in the Parameters window, normally located at the bottom of the screen when editing.
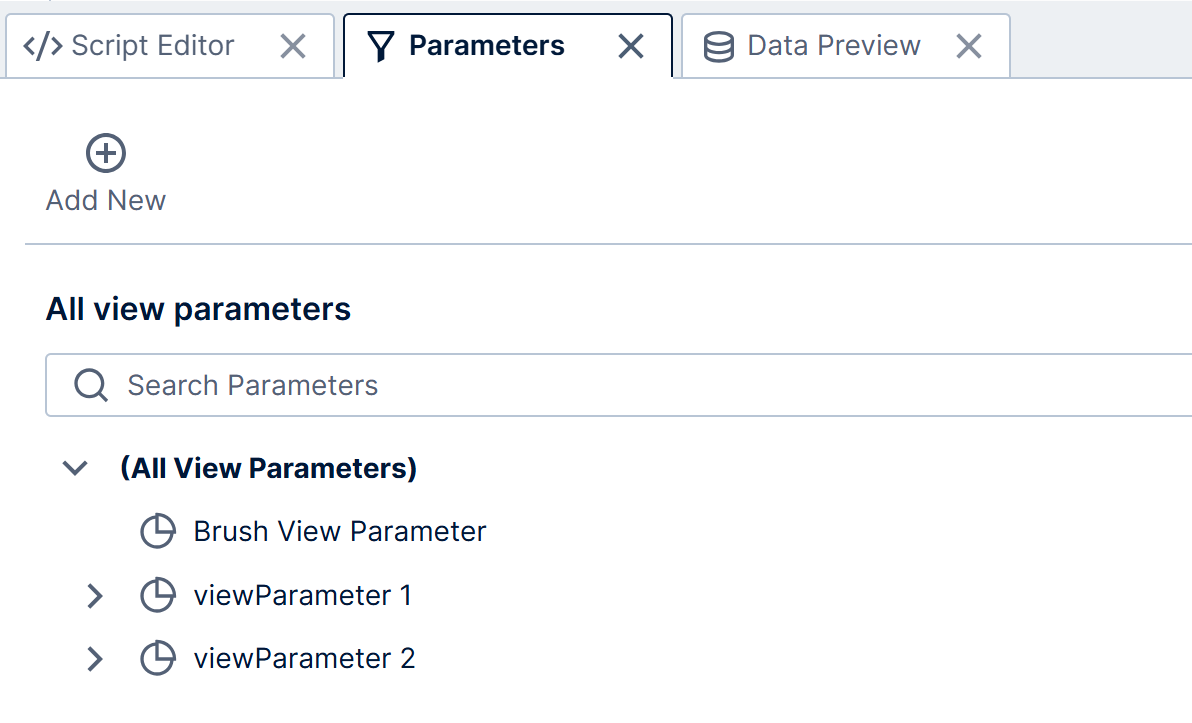
View parameters are also used for interactions, such as when a chart is set up to filter other visualizations when a data point is clicked. If the filter and an interaction are connected to the same view parameter, the filter can automatically update when the user interacts with the visualization, triggering the interaction.
If you want to change what view parameter a filter is connected to, click the Parameters button in the Connect Filters popup.
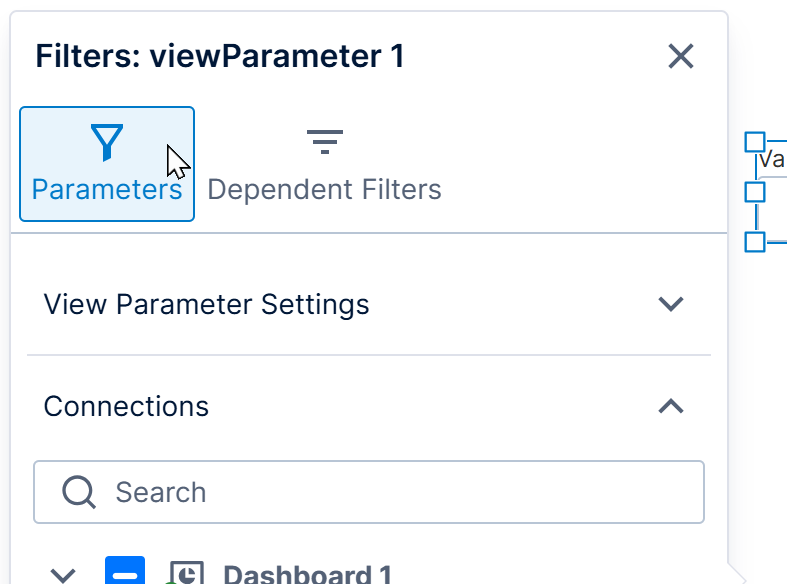
Here you can use the checkboxes to select which view parameter(s) should be changed by this filter. To ensure the filter also updates itself automatically when the view parameter changes a different way, such as through a filter interaction, choose just one view parameter.
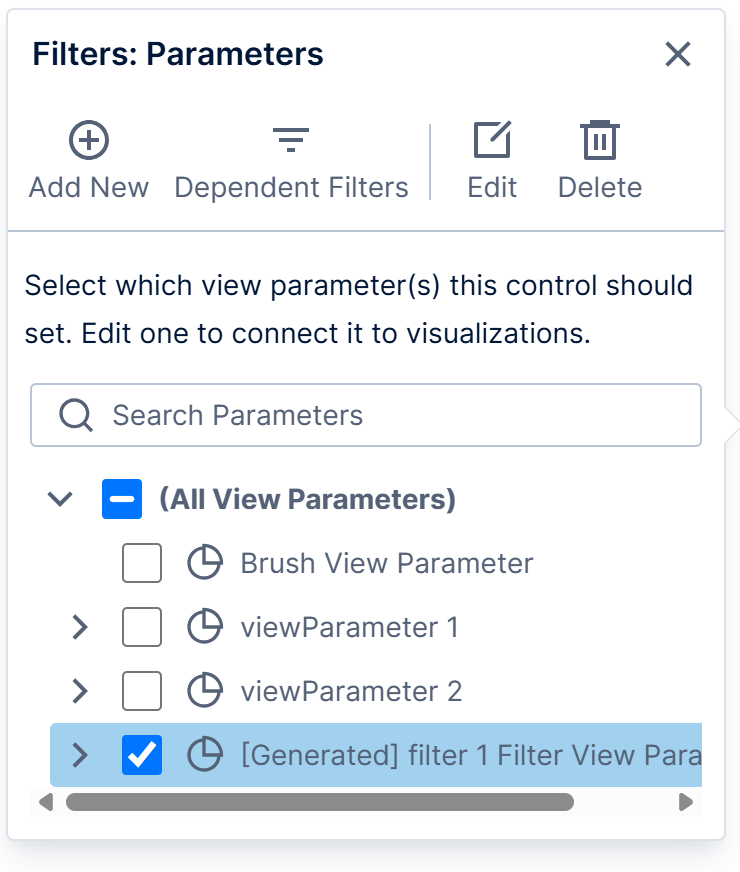
To return to the view parameter's details normally shown in this popup, select it and choose Edit in the popup's toolbar or the view parameter's right-click menu.
7. Tokens
Most filters and their parameters allow you to choose from a list of options besides the data source values, called tokens. The token menu can be accessed from the button to the right of the filter.
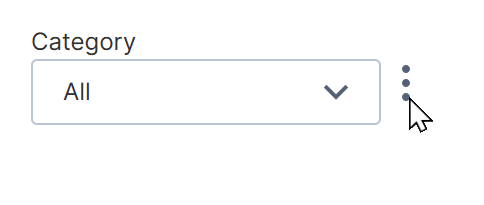
- The most common is the All token, which is what is often selected by default. This represents all possible data source values, or no filtering.
- The Data Default token represents the default value that was set at the metric set level or at the data cube level.
- Calendar and date/time filters offer a wide variety of common relative time tokens that can automatically change over time after setting them only once, such as Today or Year to date. When using a range filter with From and To inputs, each token menu may contain different options, where some options such as Current year set both inputs at once while others such as End of current year set only one.
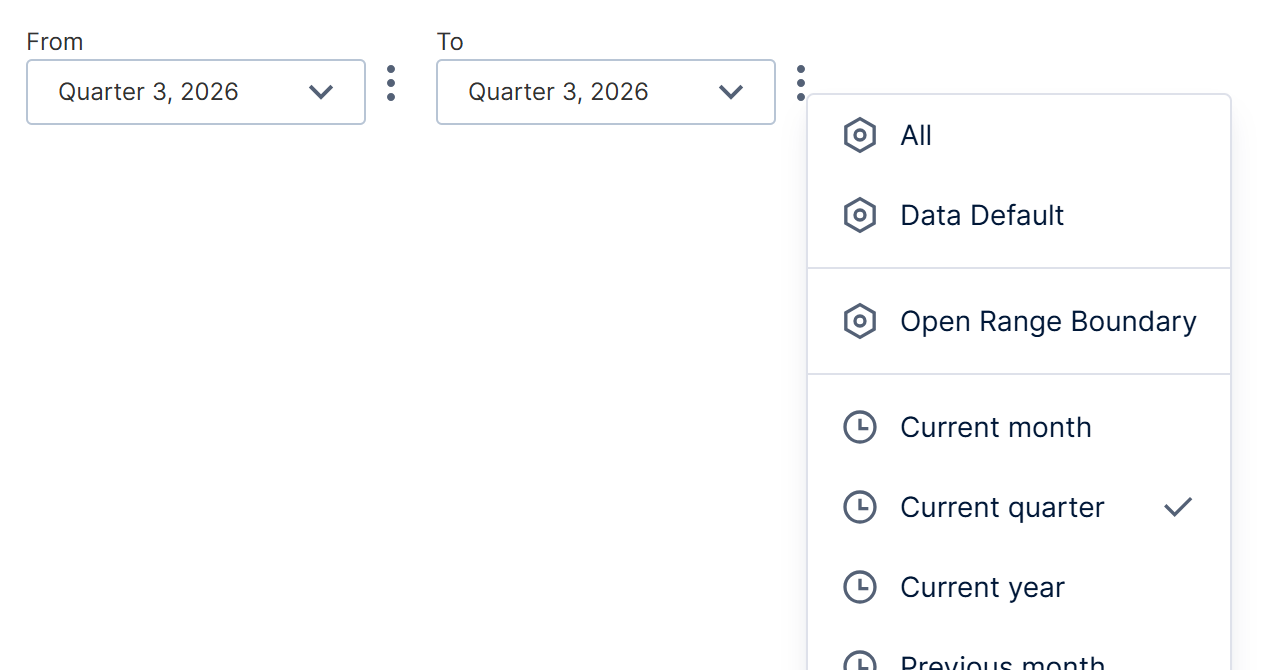
Some of the relative time tokens available under To NoteTokens that set an entire range and tokens that affect only the start or end are not compatible with each other. After switching between them, confirm the tokens you want are shown as selected with a check mark when you reopen the token menu. - When the relative time tokens don't provide what you need, choose Advanced... at the bottom of the tokens menu, choose one of the existing tokens, and then an offset. For example, Today offset by 1 represents tomorrow, while Current month offset by -3 represents three months ago.
You can also create your own tokens:
- Add a Data token to represent whatever the first, last, minimum, or maximum value of a column currently is.
- For time dimensions or date/time data, create custom Relative Time tokens by choosing a time dimension level such as Month and an offset, and assigning a name.
- Assign a name to a set of values selected in a hierarchy value filter to create a Named Set token to reuse later.
- You can create a Script token to use in the token menu for any type of filter or data.
See Creating custom tokens for more details.
8. Customizing filters
You can quickly change the label displayed above a filter by clicking Edit Label Text (or Edit Start Label Text, etc.) in the toolbar, typing in a new label directly into the filter, then pressing the Enter key or clicking away.
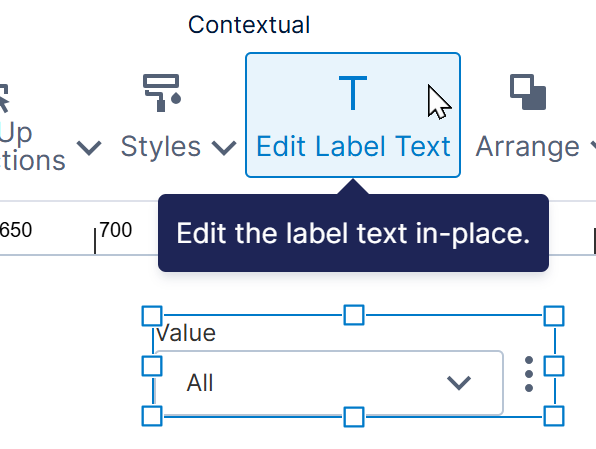
Users with access to the Properties window can customize filters further. Some common properties:
- Use the Shown Tokens property on most types of filters to restrict the tokens available from the token menu.
- You can choose whether to show the token menu using the Hide Token Menu property. For range filters, set the Token Menu Visibility property instead and choose whether to show/hide the menu for the start value, end value, or both.
- In filters that display hierarchy members, select the Hide 'All' Item option in the General tab under Filter Values (in the Look tab in previous versions) to hide the hierarchy's own 'All' member listed above the other values, which is separate from the All token.
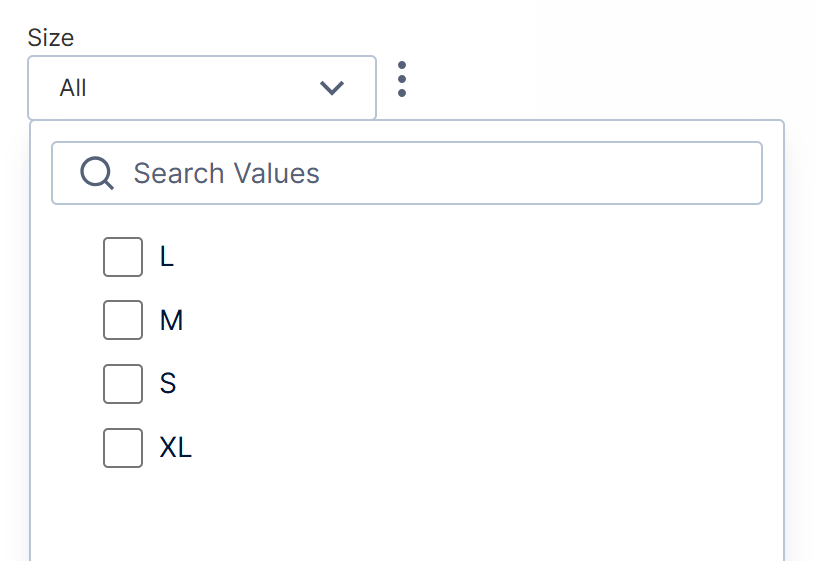
Hidden All member - Use the Shown Members property of a hierarchy value filter to restrict the values that can be chosen.
- Un-check the Show Checkboxes property of a hierarchy value filter to allow only a single value to be selected.
- Filters with multiple fields such as Calendar Range and Cascading can be laid out vertically rather than horizontally by selecting the Vertical Layout option in the Design tab under Layout & Spacing (previously the Layout tab).
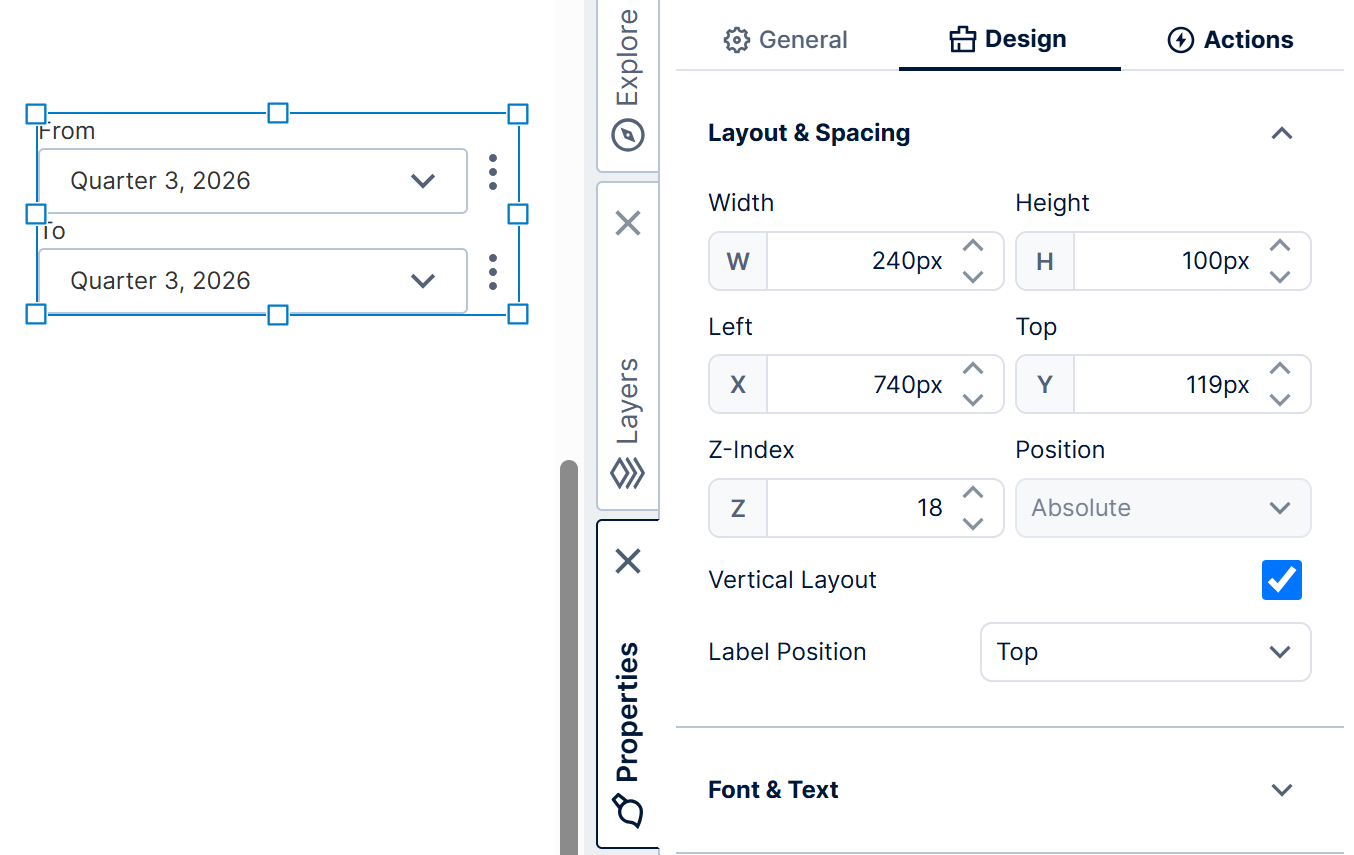
Calendar range filter with vertical layout - Date/time filters can allow time of day to be entered if the Time Granularity property is set to a unit of time. Choose the smallest unit of time that you want to be able to enter.
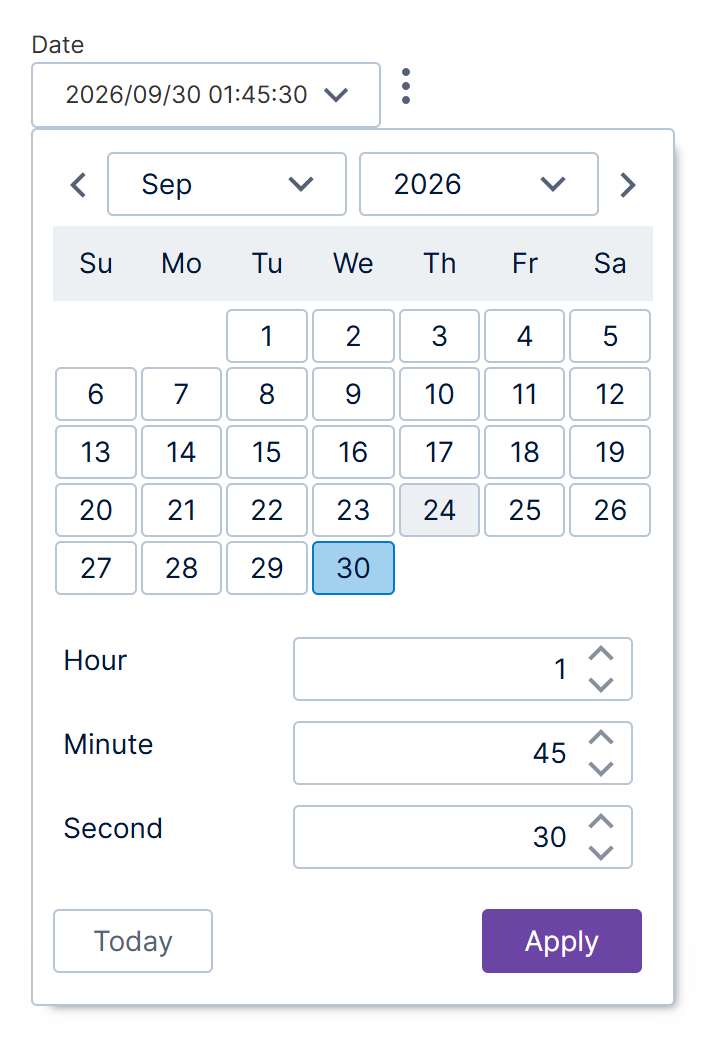
Setting hour, minute and second