
There is nothing of absolute certainty in this world, except for death, taxes, and accidentally deleting something you really shouldn’t have deleted. Lucky for you, there's the Recycle Bin.
There is nothing of absolute certainty in this world, except for death, taxes, and accidentally deleting something you really shouldn’t have deleted. Lucky for you, there's the Recycle Bin.
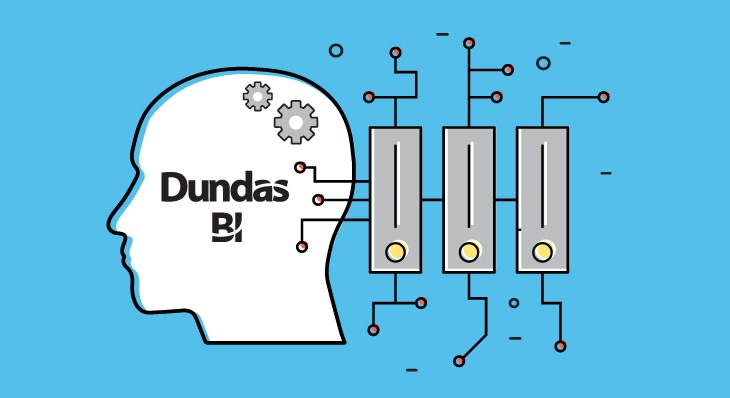
When it comes to business intelligence (BI) tools and the way they work with data, there are three main data flow techniques that are typically offered.
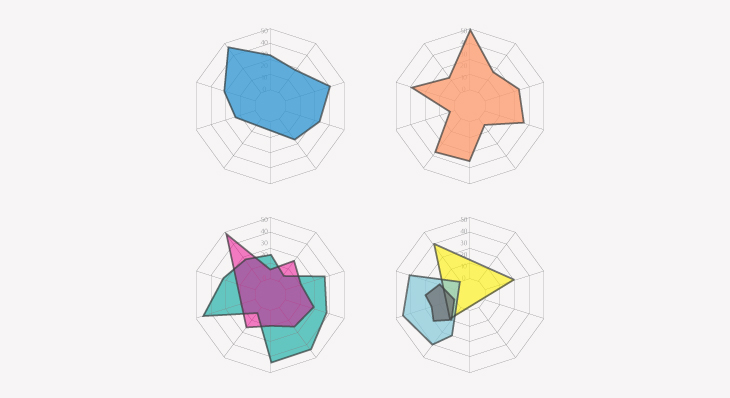
Interested in comparing multiple quantitative variables? Then let's take a comprehensive look into one of Dundas BI's newest data visualizations, the Radar Chart.
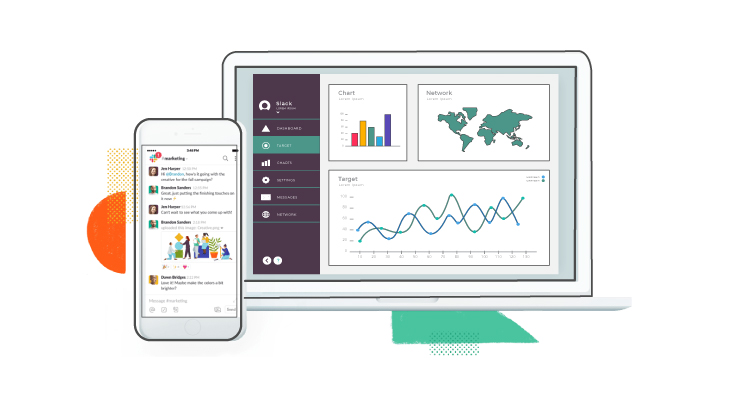
The Export Delivery API allows users to export and deliver Dundas BI exports through notifications, creating a more collaborative business intelligence experience.

We're focusing on one of the new ways Dundas BI simplifies data models and enables users to easily explore data in a logical and organized fashion by using Hierarchy Attributes.
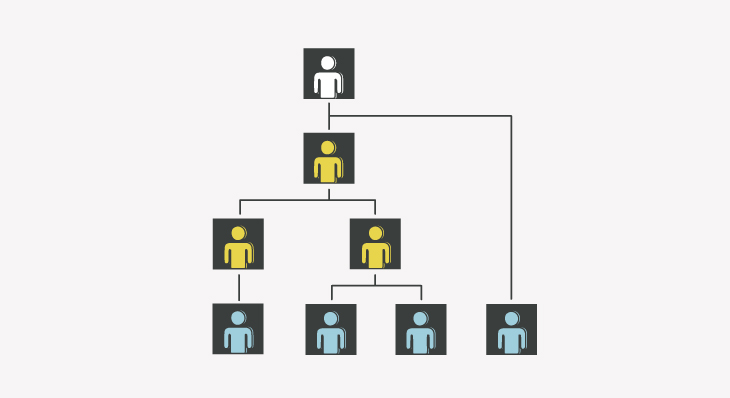
One of the more common challenges a lot of organizations encounter, is around being able to manage their hierarchies when they’re not perfect. Dundas' support for ragged hierarchies remedies that.
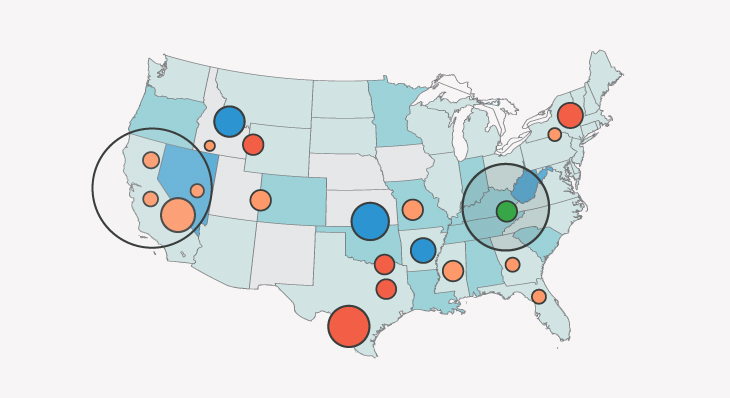
Use map and diagram animations to faster detect changes across geo-locations. With these powerful animations, users are immediately able to cognitively identify changes in their geographical data.

The possibilities when working with weather data are near endless. Let's explore how we can incorporate and visualize weather data in dashboards in Dundas BI

BI success depends on its adoption by end-users. This is why it's crucial you provide them with options to navigate to the content they want in a way they're comfortable with. Enter, JavaScript.
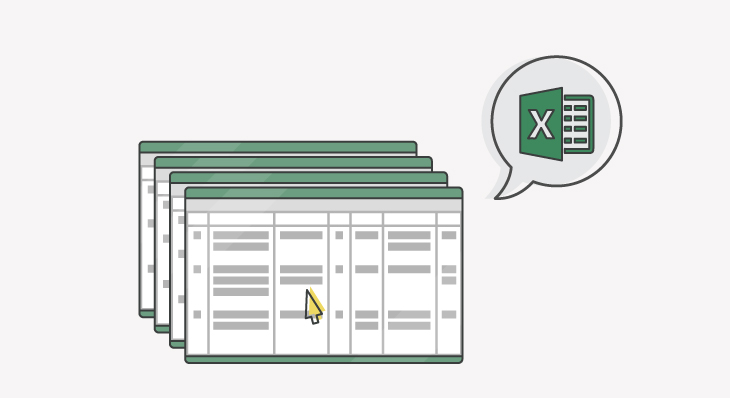
Business users who frequently work with Excel data will love Dundas BI's ability to automatically detect tables within non-standard Excel files
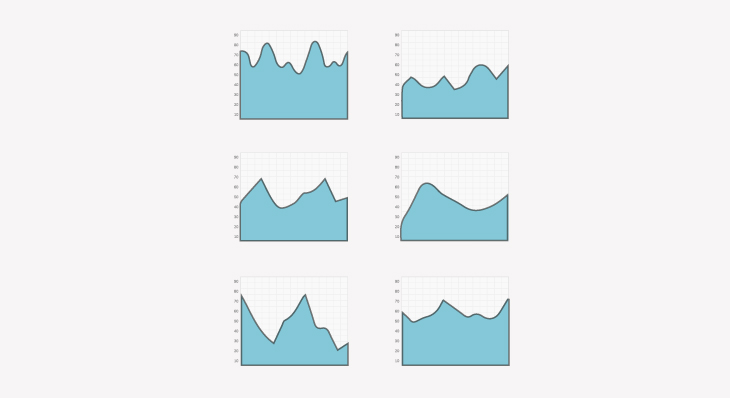
Small Multiples are a series of graphs or charts that may interchangeably be referred to as Trellis Charts or Panel Charts. They enable you to uncover patterns in complex data.
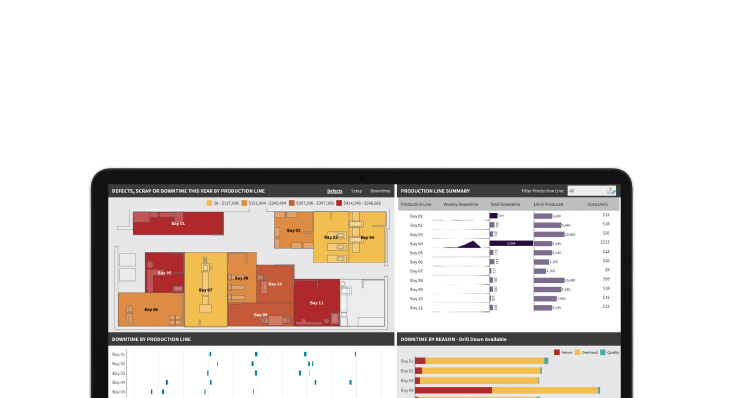
Don’t simply show your data, tell a story with it! By combining Custom Diagrams with an analytics platform like Dundas BI, we're able to visually communicate complex information with ease.