
These days, most employees work with data, regardless of their role—but they’re not necessarily interpreting that data. And they’re not necessarily finding any insights in that data.
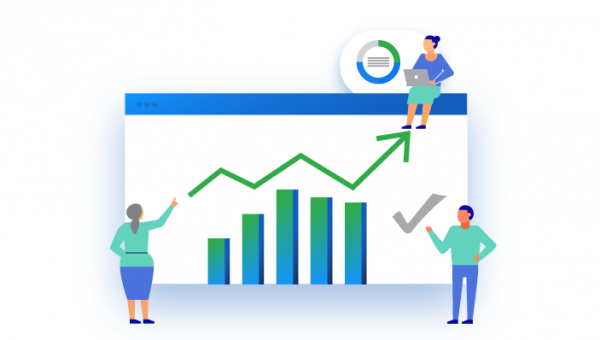
These days, most employees work with data, regardless of their role—but they’re not necessarily interpreting that data. And they’re not necessarily finding any insights in that data.
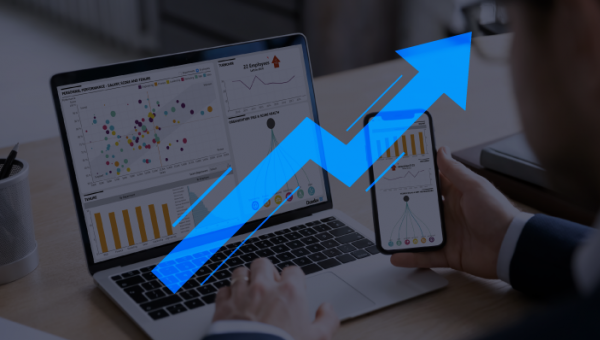
Whether it comes in the form of an interactive dashboard on your computer screen or a multi-page report on your desk, data helps to inform decision-making, uncover trends and insights, and even forecast the future.
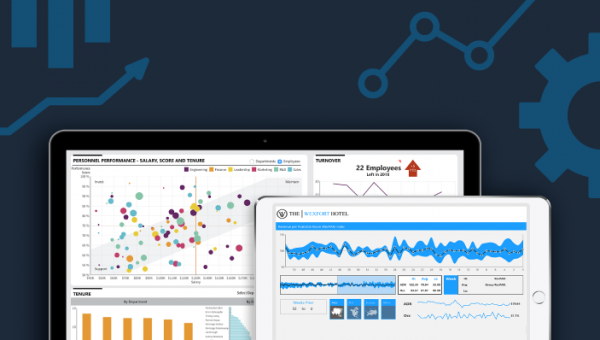
When it comes to using a Business Intelligence (BI) platform, typically, a company will fall into one of two scenarios regarding the usage of these platforms.
![The Benefits of Business Intelligence [Infographic]](/resources/images/2021/08/12/730x398_cover_thumbnail.png)
Business Intelligence has always been important but now it's essential.
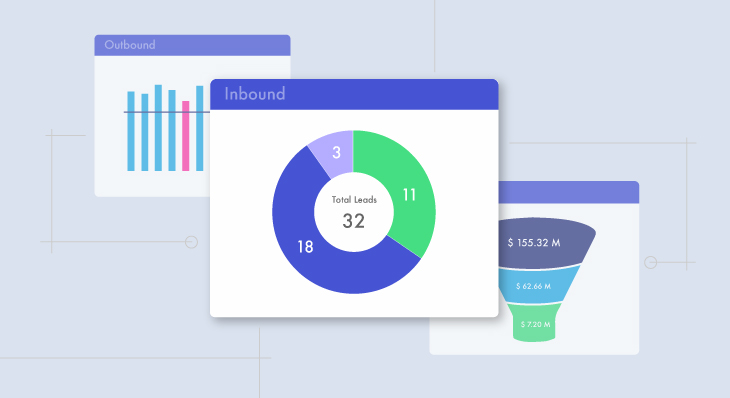
Give Sales managers a dashboard that empowers them to drill into and diagnose performance issues based on the numerous activities that lead to opportunity creation their Sales teams partake in and allow them to discover new ways to grow future revenues.

Businesses can make better decisions amid uncertainty and fear - and rapidly adapt and adjust to changes in real-time - by using facts and data as the driving force behind decision-making.
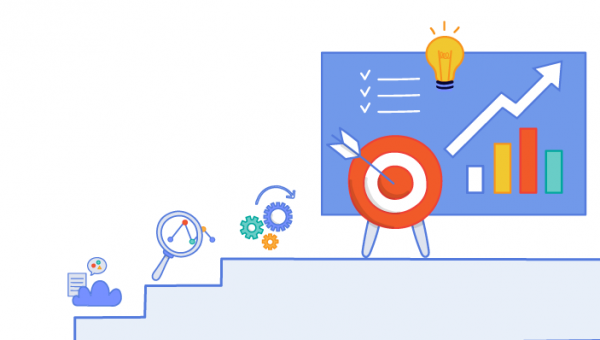
Self-Service analytics is all the rage these days; IT departments don't want to be the permanent “BI Department,” and users don't want to be waiting on someone else for their data insights
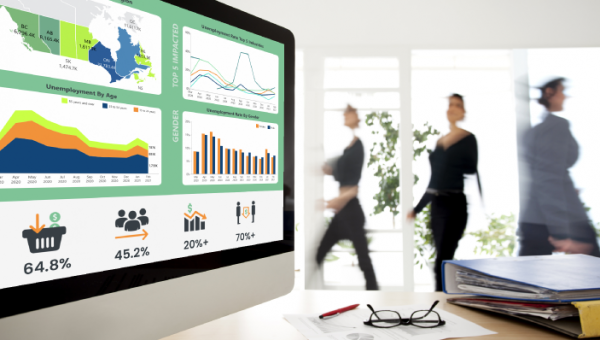
For years companies have been using data to identify trends, uncover insights and gain competitive advantage.

It's time to stop thinking about Business Intelligence as a cost, rather than a way to save or make money.
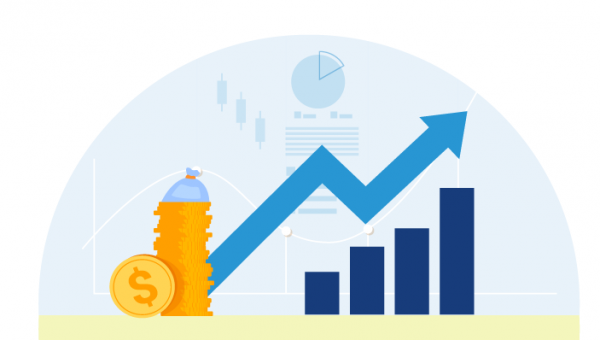
When we think about a return on an investment we’ve made — whether hardware, software, or even people — we often measure that investment in dollars.
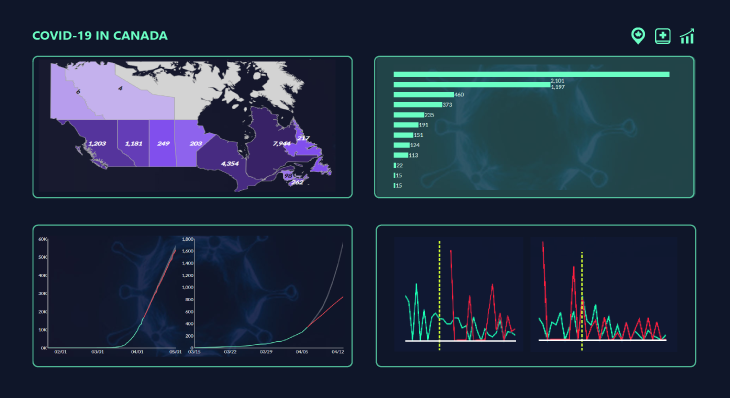
The team at Dundas has created a real-time, interactive COVID-19 dashboard to help our fellow Canadian businesses and communities better explore the data, stay informed and safe, and take action.

Real users of Dundas BI offer their personal opinions on how business intelligence has enhanced their remote work experience for themselves and their teams.