
3D charts are frowned upon in the data visualization world, especially when it comes to 3D Pie and Bar Charts. This begs the question - are there any valuable 3D visualizations?

3D charts are frowned upon in the data visualization world, especially when it comes to 3D Pie and Bar Charts. This begs the question - are there any valuable 3D visualizations?

The ability to group data on-the-fly is incredibly powerful. It's helpful when correcting data errors or grouping similar datum to form single data points or for answering hypothetical questions

With Dundas BI 5, we’ve taken our existing Map Visualization and set its functionalities ablaze by incorporating Heat Maps.

A Slope Graph is a line chart variation that is typically used to emphasize change in time for different categories in your data and how each stacks up against the other. Let's build one in Dundas BI

The Parallel Coordinates Chart is a uniquely valuable visualization in the sense that it allows you to examine large quantities of data at-a-glance, while simultaneously analyzing individual measures.

With Dundas BI, you're able to calculate the distance between two locations using a built-in formula.

Dashboards are a great way to visually represent your data to track, analyze and display KPIs at-a-glance. One of the ways to enhance the readability of a dashboard is by making use of animations.

With Dundas BI 5, we’ve added two new visualizations to the relationship category. Dundas BI now has four, which include the Tree Diagram, Chord Diagram, Relationship Diagram, and Sankey Diagram.
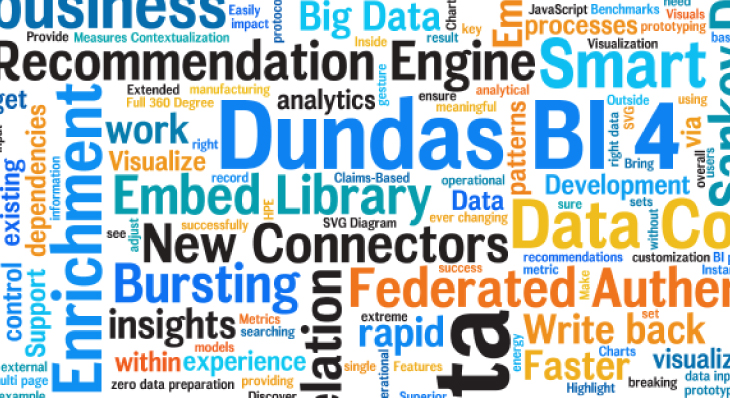
Word Clouds (or Tag Clouds) are excellent options to help visually interpret text and are useful in quickly gaining insight into the most prominent items in a given text

Cohort Analysis enables you to easily compare how different groups or cohorts of people behave over time, allowing you to draw insight regarding trends and business processes.

Everybody has their own baggage when they start using new software – specifically for BI and analytics software. Here are 5 things I wish I'd known when I started using Dundas BI.

For analytics projects to transform the way people manage their decisions, speed is often a necessity. This blog focuses on Dundas BI's in-memory engine and the role it plays in optimizing performance