
Dashboards & Data Visualizations
-
Must-Have Features for Successful Embedded BI Projects
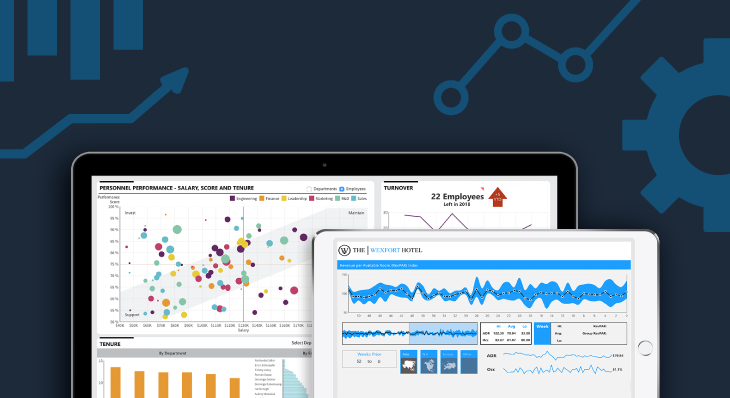
When it comes to using a Business Intelligence (BI) platform, typically, a company will fall into one of two scenarios regarding the usage of these platforms.
-
What If What If Analysis Wasn't A What If?
What-If Analysis is the idea of changing input values to see the outcome of your data based on given adjustments.
-
The ROI of BI: How Will BI Pay for Itself?
It's time to stop thinking about Business Intelligence as a cost, rather than a way to save or make money.
-
Predictive Analytics: Capabilities in Dundas BI
Predictive Analytics is an often talked about feature in Business Intelligence.
-
Predictive Analytics: Debunked
Predictive Analytics is one area of Business Intelligence (BI) that users tend to have very high expectations about.
-
Storytime: The Switch Dashboard
In this video, I share a concept that we use when putting dashboards up on big-screen TVs around the office.
-
Business Intelligence Requirements Gathering: What to do Before Building Dashboards
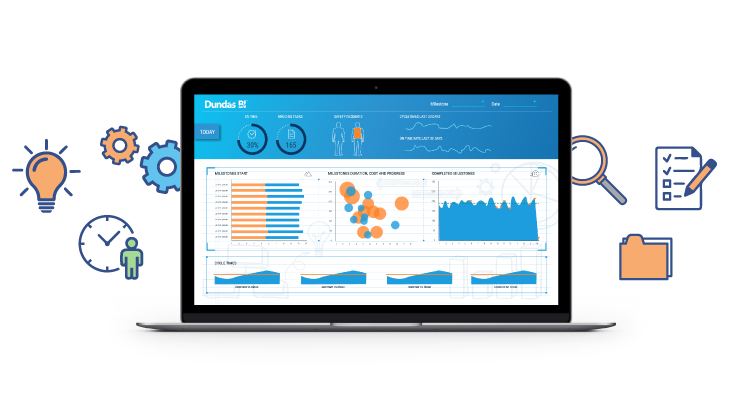
To make your BI project a real success, comprehensive requirements gathering is the first and the most important step of the journey.
-
The Problem With RAINBOW Line Charts: A Dashboard Tip
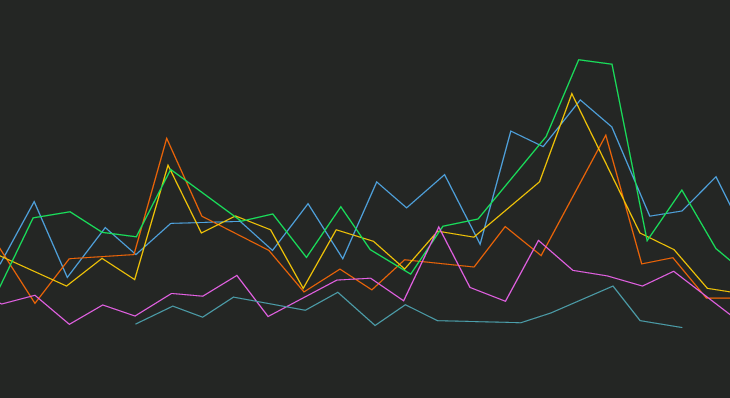
Finding an alternative to simply jamming too many series onto a single chart.
-
Looking for Business Intelligence? Important Questions to Ask Potential Vendors

When you evaluate a BI tool, you need to ensure the tool you choose will evolve with your requirements.
-
Why You Need To Start Using Cycle Plots In Your BI Projects

Cycle plots are an elegant visualization very few people have heard of but especially useful to understand data trends across individual segments.
-
Self-Service Analytics Dashboards: A Performance Feature You Must Have
Self-Service dashboards give users the freedom to explore enterprise datasets to make actionable decisions with minimal to no IT support.
-
New to Dashboards? Stop Doing This
Dashboards are meant to give insights. Don't just treat them like 'pretty reports'.
-
Dundas Rewind! The Best BI & Data Analytics Content of 2020
With 2020 squarely in the rearview mirror, let's rewind and examine the best business intelligence and data analytics content of the last 12 months
-
8 New Features In Dundas BI Version 8

Say hello to Dundas BI Version 8, the most powerful, highest performing version of Dundas BI to date.
-
3 Creative Dashboard Designs (And Why They Work!)
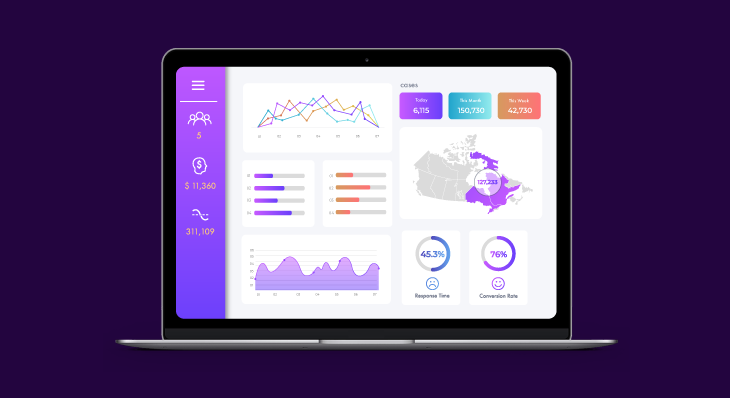
Understanding what dashboards are, what good dashboards are comprised of, and how good dashboards are designed, will help you create thoughtful, impact dashboards like these three.
-
The 5 Analytics Features You Seriously Want In A Business Intelligence Software
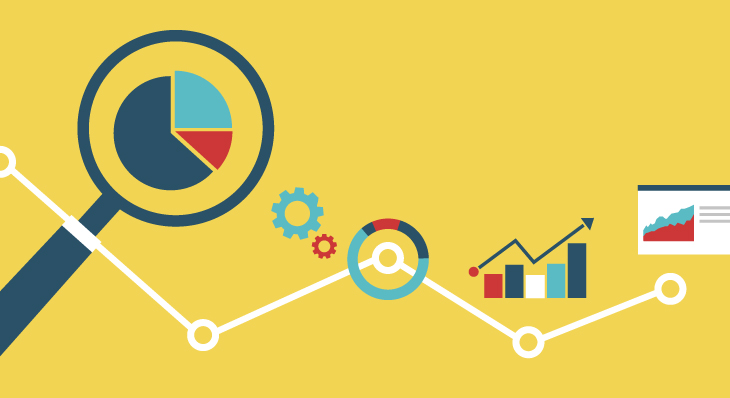
Not every business intelligence software is capable of delivering exactly what you need, and if you’re serious about doing what’s best for your data, then you’ll seriously want to ensure these 5 analytics features are present.
-
Use State Indicators To Contextualize Analysis And Communicate Insights
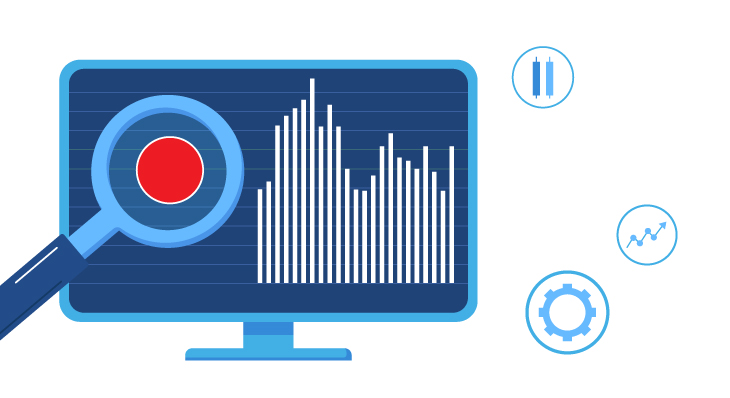
By leveraging state indicators, dashboard designers can contextualize analysis, change user’s behaviors, communicate critical information quickly, and enhance the user experience.
-
The Dashboard Every Sales Manager Needs to Drive Revenue and Maximize Performance
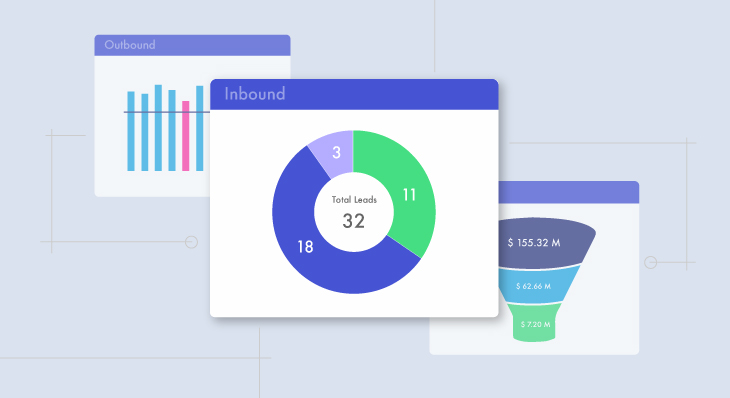
Give Sales managers a dashboard that empowers them to drill into and diagnose performance issues based on the numerous activities that lead to opportunity creation their Sales teams partake in and allow them to discover new ways to grow future revenues.
-
How to Monitor Individual Sales Performance with Real-Time Dashboards
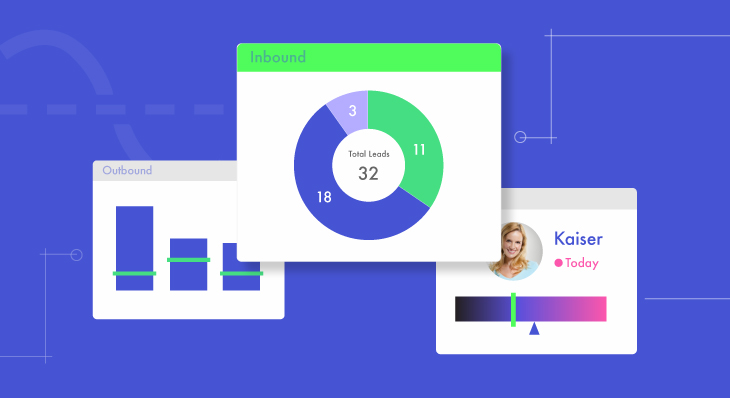
The best way to build and facilitate a Sales culture – one that rewards hard work and recognizes tangible successes – is by visualizing the status of all Sales activities using real-time dashboards.
-
4 Unique Tips to Designing Better Dashboards in Dundas BI
Dashboard design is as important as the data itself. If you want to evoke emotion and keep your users coming back for more, you'll want to incorporate these four dashboard design tips.