We recently wrote on the importance and role real-time dashboards play in encouraging individual Sales reps to boost their productivity and making Sales targets more attainable. That blog is a blueprint for understanding why we emphasize building and facilitating a Sales culture, and how visualizing the status of all Sales activities, increasing transparency and delivering unprecedented insight into daily tasks is crucial to Sales reps achieving peak performance.
And while the dashboard we built to reinforce our message is a stellar example of what can be created using Dundas BI to drive Sales reps to produce better results and generate more revenue, there’s another piece of the puzzle we’ve yet to talk about, and that’s the impact business intelligence and data analytics has on overall Sales numbers. In addition to providing deep, granular insight into individual key performance metrics, data analytics software has the capacity to accurately link all activities to revenue and paint a more holistic picture of the greater Sales landscape.
This is why we’ve decided to build a Sales Management and Revenue Dashboard and will be walking you through it today! Whereas Sales reps have a tendency to be more concerned with their own performances, Sales managers care more about high-level analyses that drive business decisions and identify the actions and activities needed to correct or improve corporate results. Yes, Sales managers are still interested in tracking individual Sales activities, however, it’s vital they are also equipped to identify and prevent trends that could potentially result in efficiency challenges, as well as identify new opportunities for incremental revenues.
Click here or on either of the following images to interact with the Sales Management and Revenue Dashboard. This dashboard was optimized for desktop monitors.
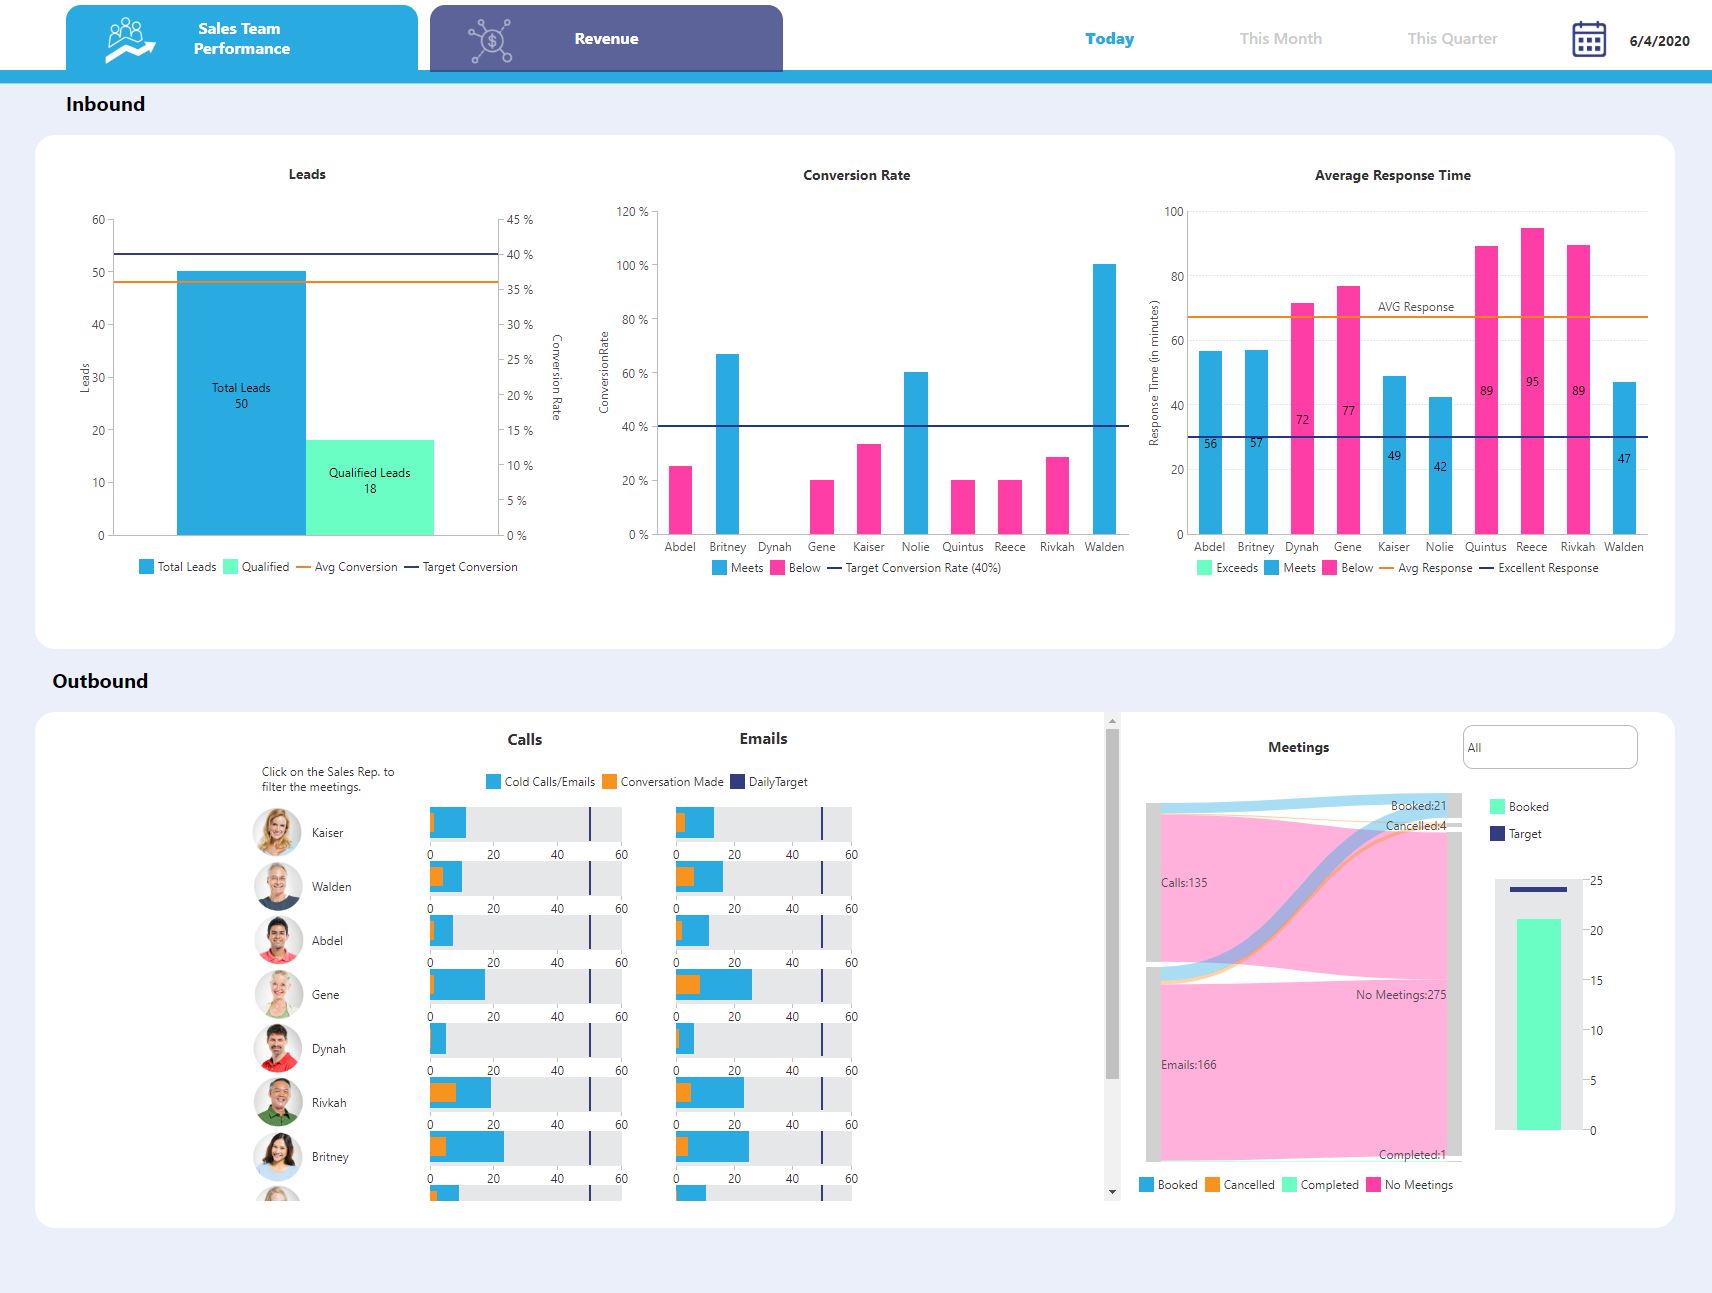
Figure 1: Sales Management and Revenue Dashboard Tab 1 – Sales Team Performance
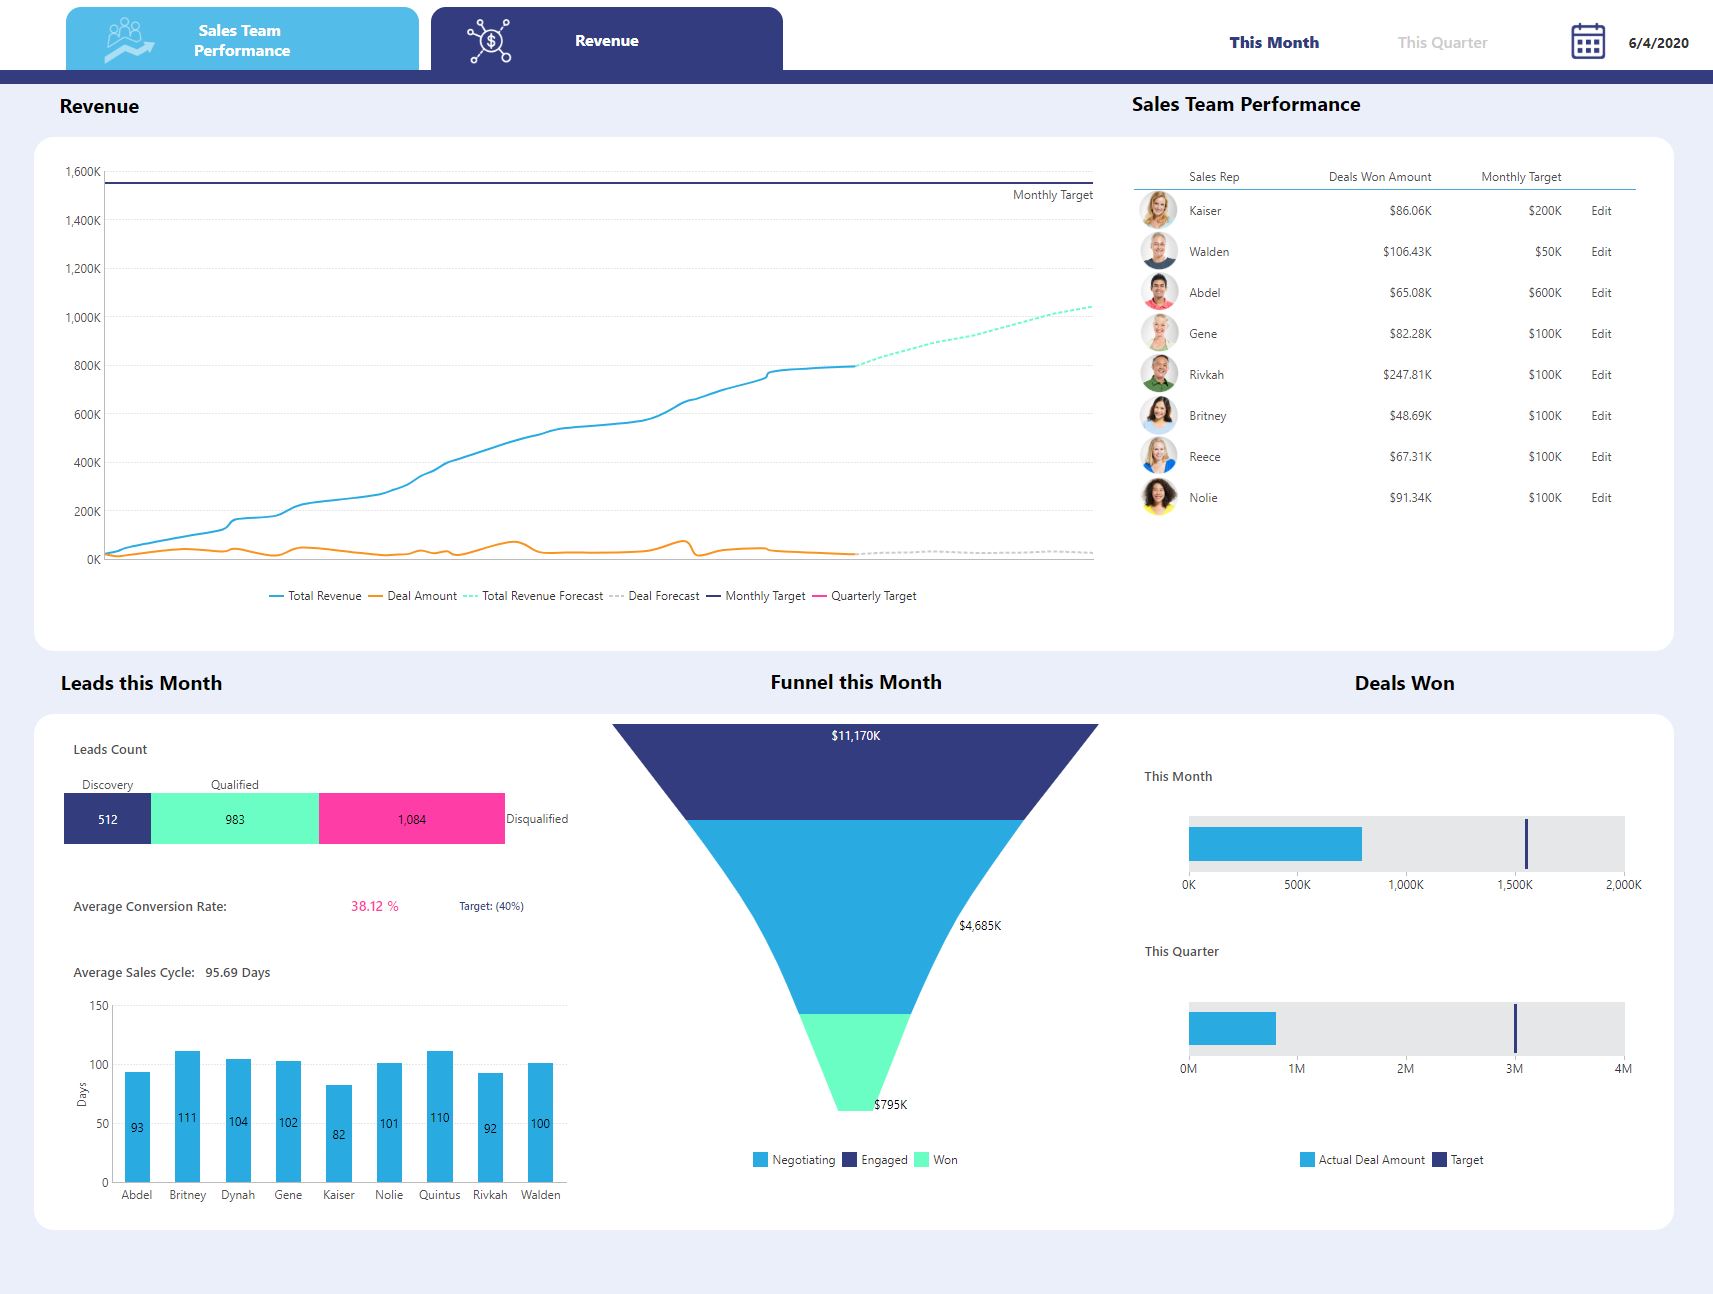
Figure 2: Sales Management and Revenue Dashboard Tab 2 – Revenue
While this dashboard is a sample which uses fabricated data – in practice, it’s a highly effective view and equips Sales managers with the tools they need to monitor performance, identify areas of improvement, and discover new opportunities for growth: pipelines, revenues, conversion ratios, win-ratios, and more.
Not only is this highly detailed Sales dashboard exhaustive in what metrics it reports on, it’s also highly interactive and contains an analysis feature that you likely won’t encounter anywhere else. Let’s take a closer look at each element of the dashboard and discuss what information is being shared and how Sales managers can use these insights to diagnose performance issues based on activities that lead to opportunity creation and can identify the leads and activities that will lead to future revenue.
While not applicable to all Sales processes, for the purpose of this dashboard, the following are Sales activities leading to revenue that a Sales manager would be interested in tracking:
Sales Team Performance Tab
You can think of the Sales Team Performance tab as being a direct extension or overview of the Individual Sales Performance Dashboard. Whereas that dashboard tracked and measured individual Sales performances pertaining to Inbound and Outbound activities, this first tab of our dashboard aggregates all that information into one view, allowing Sales managers to ‘get-the-lay-of-the-land’, so to speak.
Sales managers can, at-a-glance, visualize how each Sales rep is performing in relation to their peers, recognize where improvements must be made and action taken, and determine whether or not the Sales team has reached and surpassed the targets set for them at daily, monthly, and quarterly intervals. This dashboard also helps Sales managers set more realistic, attainable goals and empowers them to encourage and incentivize their team to perform as effectively as possible.
Inbound
What are we tracking?
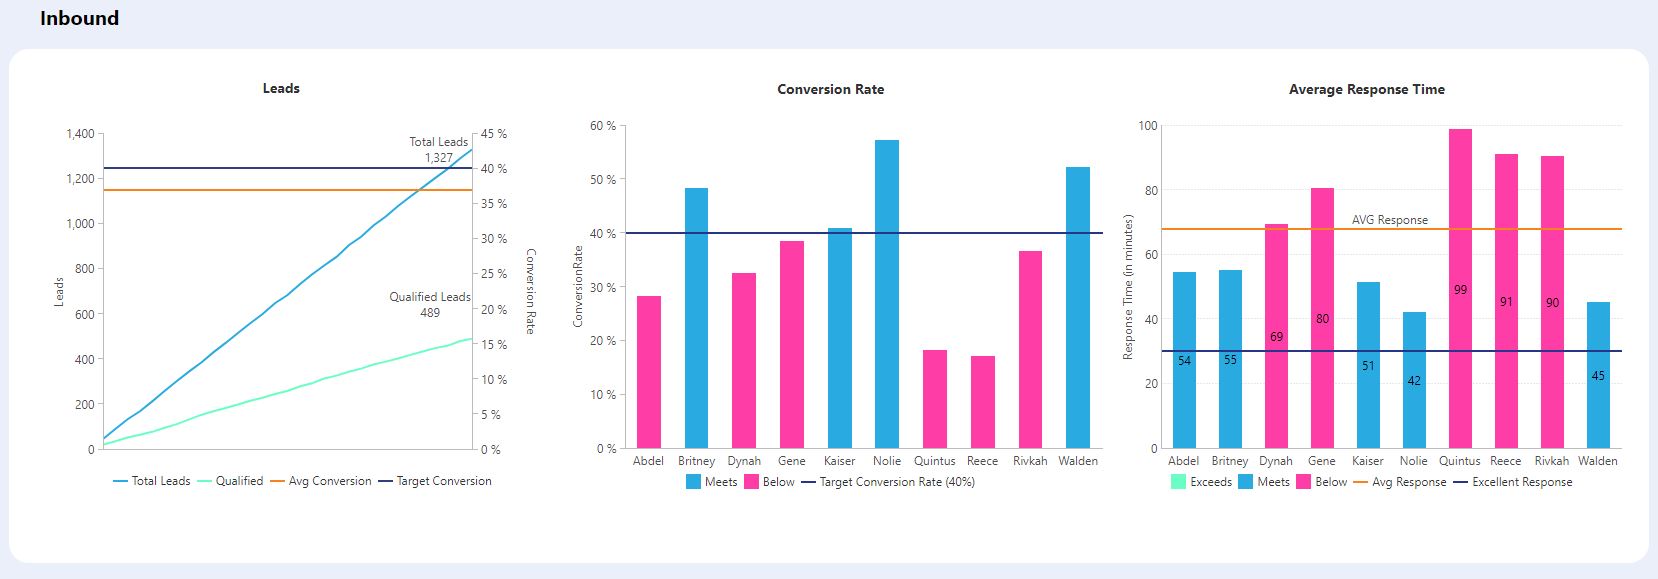
LEADS
- Total Leads
- Qualified Leads
- Average Conversion Rate
- Target Conversion Rate
LEAD CONVERSION RATE
- Individual Conversion Rates
- Target Conversion Rate
AVERAGE RESPONSE TIME ON LEADS
- Individual Response Times
- Target Response Time
- Stretch Target Response Time
Each of the Key Performance Indicators (KPIs) in this section of the dashboard can be understood by all and are easily actionable. The data changes in real-time, allowing Sales managers to stay updated on the status of all Inbound activities.
Outbound
What are we tracking?
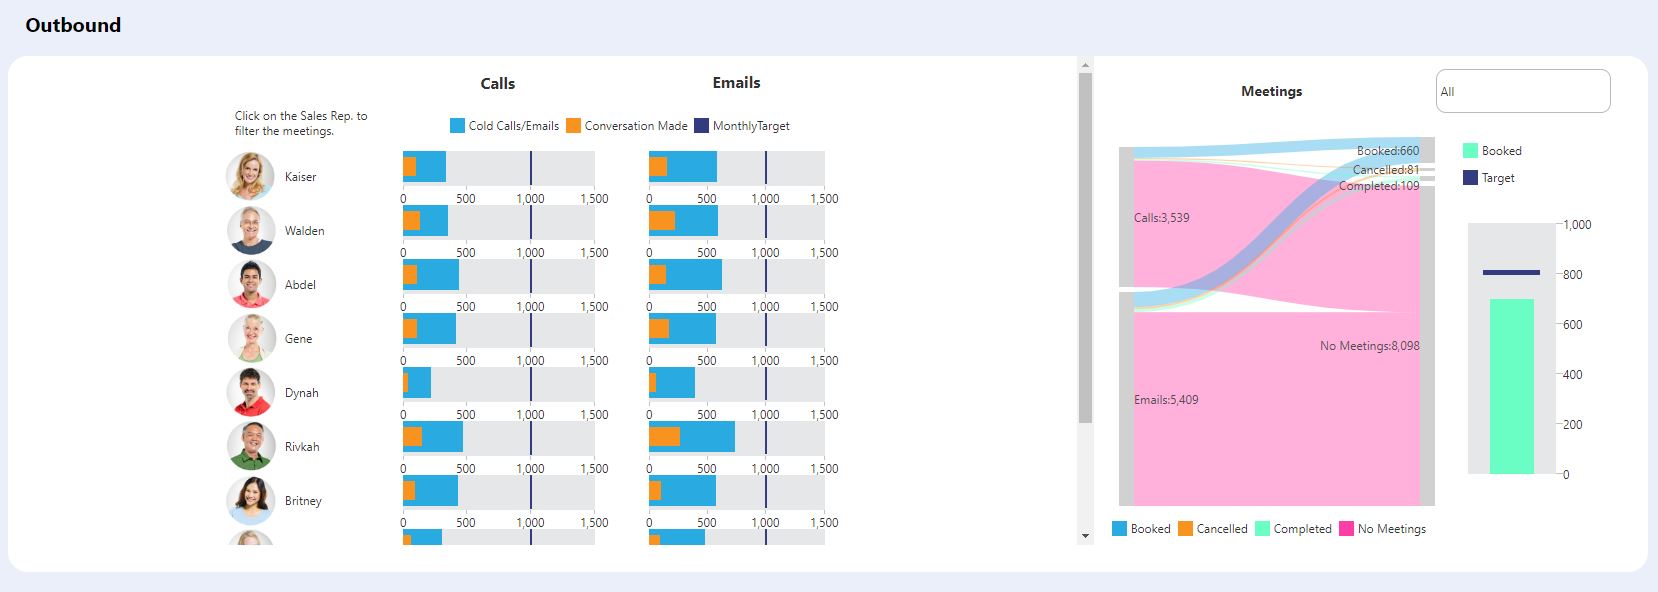
CALLS
- Cold Calls Made
- Conversations Had
- Target Cold Calls Made
EMAILS
- Cold Emails Sent
- Conversations Had
- Target Cold Emails Made
MEETINGS
- Meetings Booked
- Target Meetings Booked
What’s unique about the Outbound section of this dashboard, is the inclusion of the Sankey Diagram. This type of visualization is designed to show relationships in a flow and is an effective tool for displaying how quantities are distributed among items between stages. We included it, as we needed a way to more clearly see the volume of cold calls and emails that eventually became booked meetings – and subsequently, those that did not.
As this is a key metric for this particular use case, it’s important we understand which activities are having a greater impact on lead generation. By hovering on the diagram, Sales managers can highlight the various flows – cold outreach to meetings booked, meetings cancelled, and meetings completed – and compare values. This provides a good starting point for analysis. Sales managers can then select individual Sales reps and filter on their data to take the analysis even further.
Revenue Tab
While individual performance metrics are undeniably important to track, there comes a time when every Sales manager needs to validate and quantify the impact their teams are having on revenue. After all, a Sales team is only effective if it’s generating enough money to drive profit and overall business growth. This is why we’ve augmented our dashboard with a Revenue tab. This tab houses key financial Sales metrics and is crucial for helping Sales managers track progress and define success. Here is where they will go to determine whether overall Sales are going to plan or have gone awry.
Revenue & Sales Team Performance
What are we tracking?
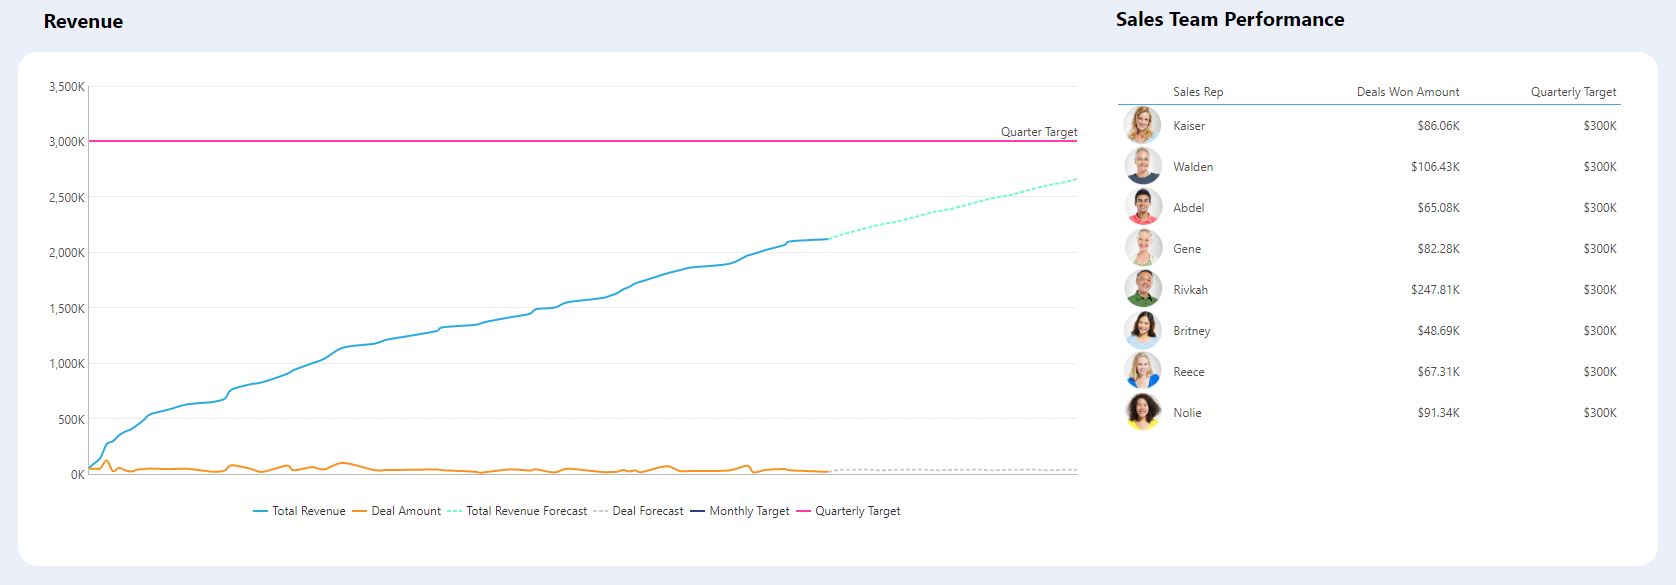
REVENUE
- Daily Deal Amounts (Total)
- Total Revenue
- Monthly (and Quarterly) Revenue Targets
- Total Revenue Forecast
SALES TEAM PERFORMANCE
- Individual Deals Won Amount
- Monthly (and Quarterly) Individual Revenue Targets
It’s super important that Sales managers are able to visualize and speak to how close – or how far – their teams are from hitting their targets. They need to be able to see immediately where they stand lest they run the risk of veering from their targets. And, in the case they are trending in the wrong direction, it’s important they have that insight in order to rectify the situation right then and there, as opposed to another month or quarter or even year later, when the damage is likely irreparable, and Sales targets are looking more like pipe-dreams.
But how do Sales managers know whether they’re actually on track? We asked ourselves that same question, which is why we leveraged Dundas BI’s Trend and Forecasting function to help Sales managers forecast future expected values.
What’s really unique about the Sales Team Performance section of this dashboard though, is the ability for Sales managers to modify data within the application to adjust performance targets on-the-fly, using Dundas BI’s Data Input functionality. There are numerous reasons why a Sales manager may be inclined to adjust Sales targets – for either the entire team or select individuals. Amongst other possibilities, they may find themselves in the midst of an economic downturn or their targets may be too unrealistic and inaccurate to begin with. Finding that sweet spot between ambitious and realistic takes time, and it helps to be able to see the impact changing individual targets has on overall revenue projections and targets.
Leads, Funnel & Deals Won
What are we tracking?
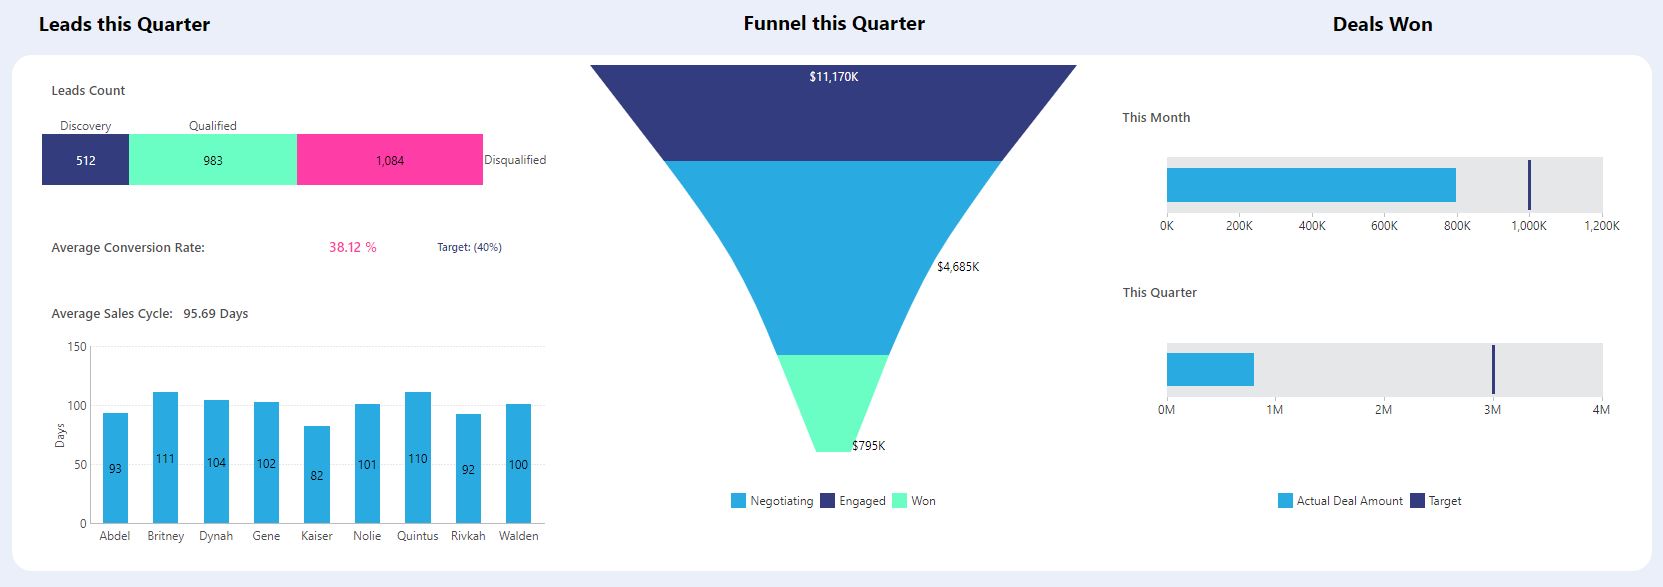
LEADS THIS QUARTER
- Leads Count (at Discovery, Qualified, and Disqualified)
- Average Conversion Rate
- Target Conversion Rate
- Average Sales Cycle
FUNNEL THIS QUARTER
- Leads at the ‘Engaged’ Stage
- Leads at the ‘Negotiating’ Stage
- Leads at the ‘Won’ Stage
DEALS WON
- Total Deal Amounts (Monthly and Quarterly)
- Target Deal Amounts (Monthly and Quarterly)
In this section, Sales managers are simply granted another view into key metrics pertaining to leads and won deals. They can use these insights to determine at a high-level whether or not their teams are qualifying enough leads – and at an effective clip. They’re able to track at which stage of the funnel the bulk of potential revenue resides and take the necessary steps to ensure as much of it as possible translates into viable business opportunities. They can make educated projections as to future revenue values based on their typical Sales cycles and what’s in their funnels and can visualize with ease how much revenue their teams are responsible for at the monthly and quarterly levels.
The high-level insights derived from this particular dashboard should function as an entry point for deeper analysis and data exploration. These insights are important; however, the majority are lagging – or backward looking – meaning they will only inform as to whether or not goals have been met; they will not tell you why the results are as they are. This is why this Revenue tab, and the Sales Team Performance tab, and the Individual Sales Performance Dashboard should always be used in conjunction with one another.
Conclusion
Sales managers care deeply about exploring data and performing analyses that illuminate trends in their Sales numbers and dictate their decision-making. They want insights that help them identify activities to correct and improve corporate results but are unsure about where to look for them and what their next steps should be. Give Sales managers a dashboard that empowers them to drill into and diagnose performance issues based on the numerous activities that lead to opportunity creation their Sales teams partake in and allow them to discover new ways to grow future revenues.
For more dashboard inspiration, take a look at our Samples Gallery – all of these dashboards are built using Dundas BI.


Follow Us
Support