Adding a dynamic element filter
1. Overview
A dynamic element filter allows viewers to choose the measure or hierarchy they want to see in a visualization via a drop down list, without any scripting.
2. Setup
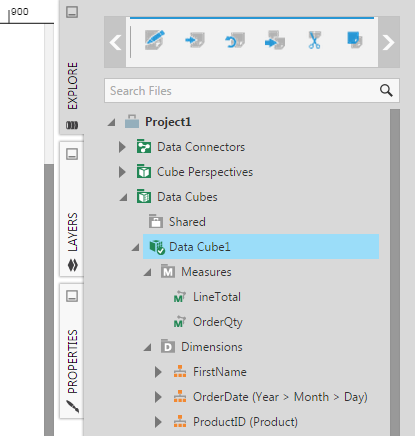
For this example, a data cube will be used which exposes two measures (LineTotal, OrderQty) and three hierarchies (FirstName, OrderDate, Product). You can build a similar data cube yourself by following the steps in this article.
3. Dynamic measure
3.1. Add the dynamic element
In this example, we first create a new dashboard for this example from the main menu using the Blank template.
We drag the OrderDate hierarchy from Explore to the dashboard canvas. It will appear as a table visualization with the Data Analysis Panel beside it.
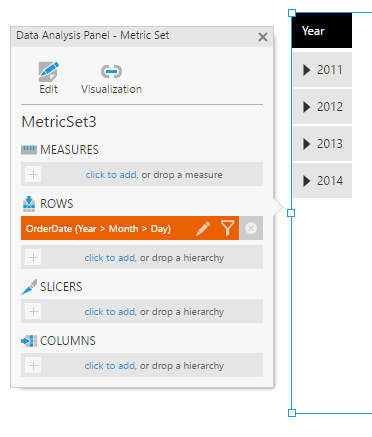
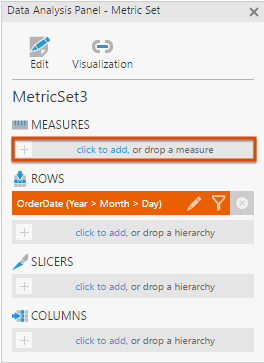
In the Data Analysis Panel, click the click to add link under Measures.
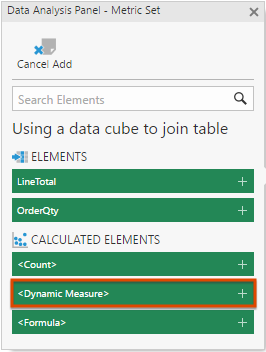
In the list of available measures to add, go to the Calculated Elements section and click <Dynamic Measure>.
The dynamic measure is added to the Data Analysis Panel and you can see that it is set to a default measure (OrderQty) in the table visualization.
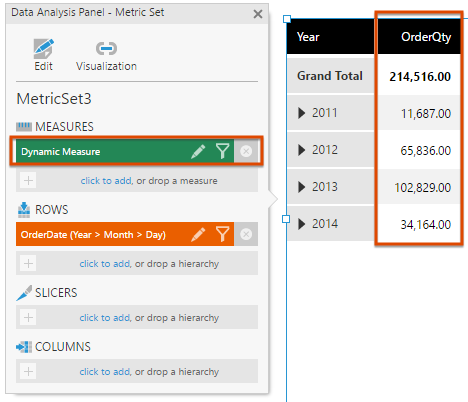
To change the default dynamic measure, click the Dynamic Measure in the Data Analysis Panel to edit it.
In the configuration dialog, expand the Parameter Values section if needed and set the Dynamic Measure drop down list to the default that you want. For example, change it to LineTotal.
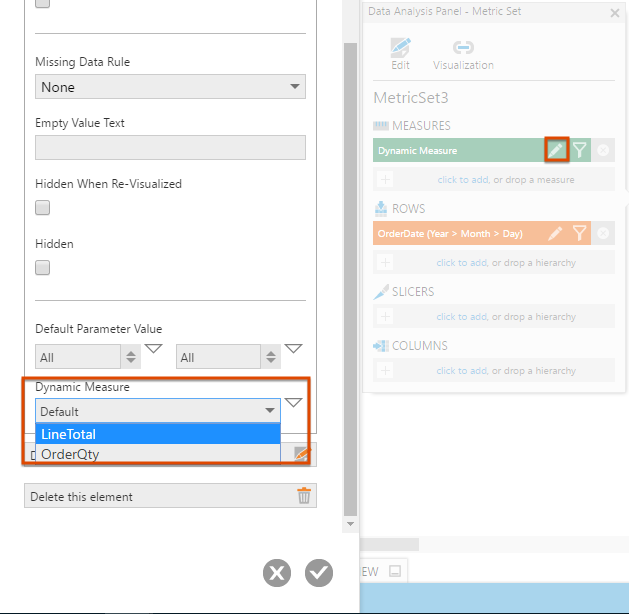
The table visualization now shows the LineTotal measure by default.
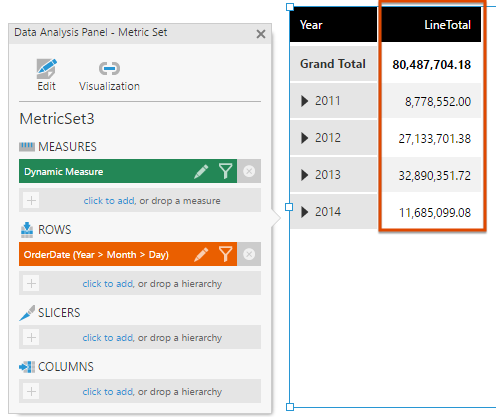
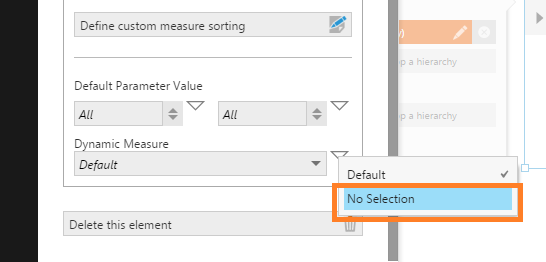
Alternatively, you can open the token menu to the right for Dynamic Measure and set the default to No Selection. This will cause the table visualization to not display any dynamic measure initially.
To determine the aggregator and formatting of each measure when it's selected dynamically, use a data cube as your data source (or promote the auto-generated one behind your metric set). The measure's supported aggregators and formatting settings in the data cube Process Result take effect, since the Data Analysis Panel will not be available in view mode after checking in. You could choose only one supported aggregator so that it always takes effect, and can set up distinct formatting for each measure.
3.2. Add the dynamic filter
The next step is to add a Dynamic Element filter to the dashboard to allow users to switch measures via a drop down list.
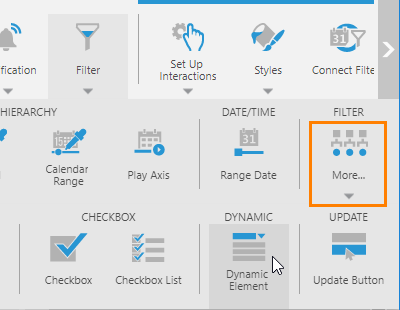
Select the table visualization on the canvas, click Filter in the toolbar, and then click Dynamic Element (found under More).
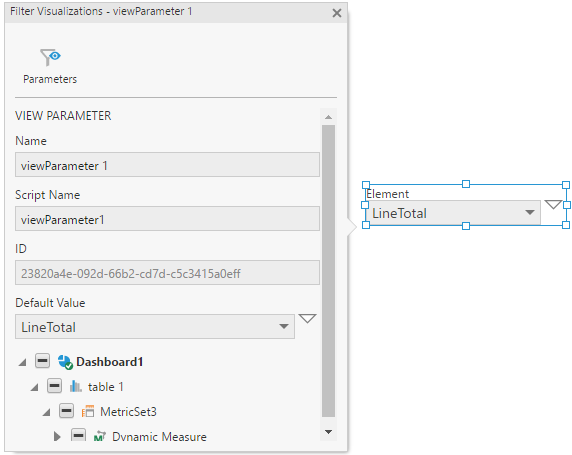
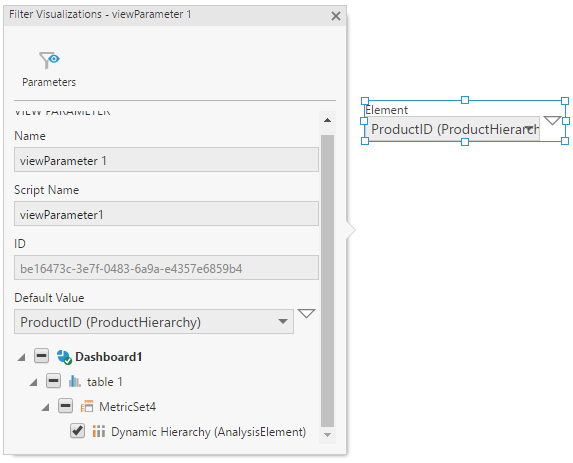
A dynamic element filter control is added to the canvas and the Filter Visualizations panel is opened automatically. The filter is already connected to the dynamic measure by default, so you can just close the panel.
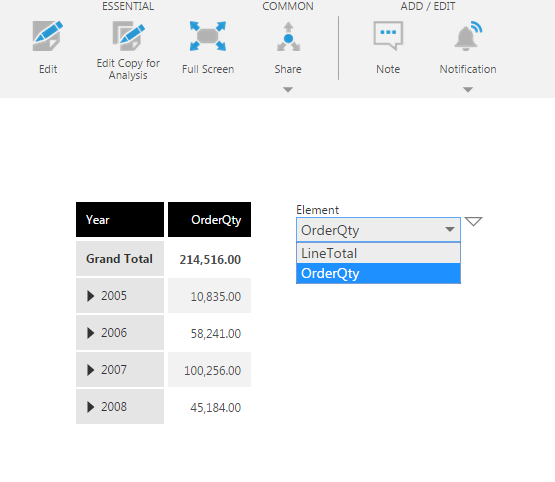
Switch to View mode and use the filter drop down list to choose the measure you want to see in the table visualization. The filter's token menu can be used to switch the dynamic measure back to its default, or to No Selection.
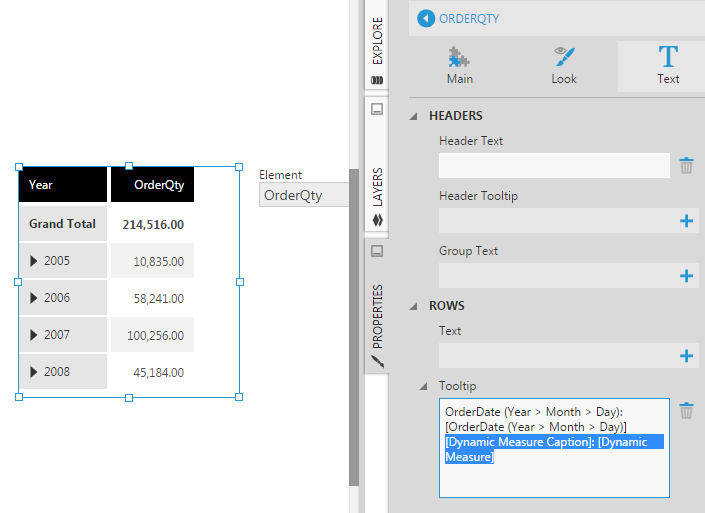
If you hover over a table cell, the tooltip will show the caption and value of the current measure. This is possible because of special keywords [Dynamic Measure Caption] and [Dynamic Measure] which you can see in the Properties for the table column.
4. Dynamic hierarchy
4.1. Add the dynamic element
Adding a dynamic hierarchy is similar to adding a dynamic measure.
For this example, first create a new dashboard from the main menu using the Blank template.
We drag the OrderQty measure from Explore to the dashboard canvas. It will appear as a table visualization with the Data Analysis Panel beside it.
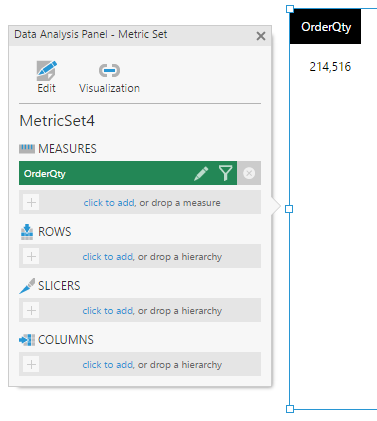
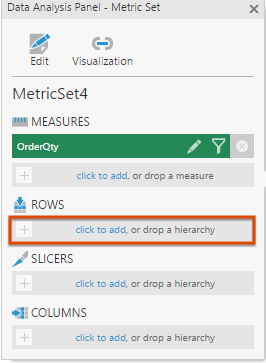
In the Data Analysis Panel, click the click to add link under Rows.
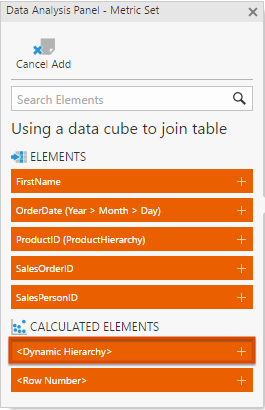
In the list of available hierarchies to add, go to the Calculated Elements section and click <Dynamic Hierarchy>.
The dynamic hierarchy is added to the Data Analysis Panel and you can see that it is set to a default hierarchy (FirstName) in the table visualization.
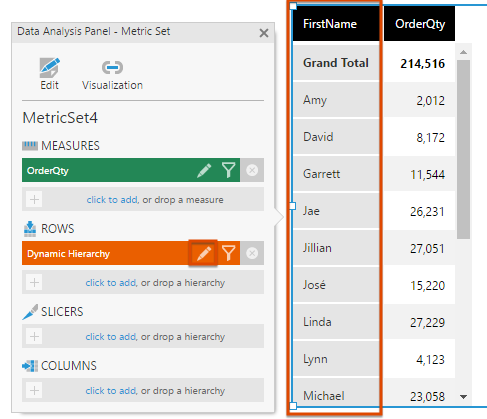
To change the default dynamic hierarchy, click the Dynamic Hierarchy in the Data Analysis Panel to edit it.
In the configuration dialog, click to expand Parameter Values if necessary and set the Element drop down list to the default that you want. For example, change it to Product instead.
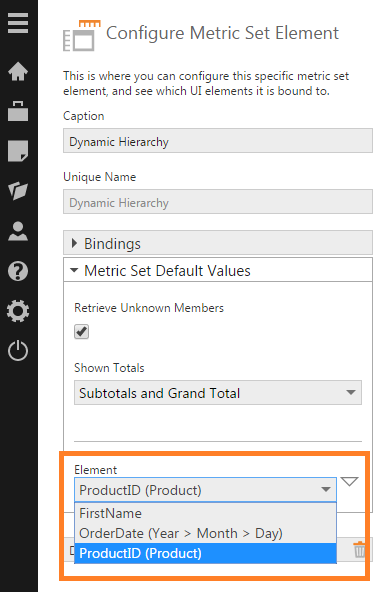
The table visualization now shows a row for each Product by default.
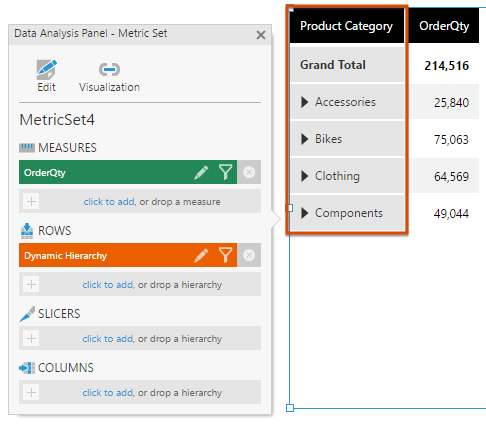
4.2. Add the dynamic filter
The next step is to add a Dynamic Element filter to the dashboard to allow users to switch hierarchies via a drop down list.
Select the table visualization on the canvas, click Filter in the toolbar and then click Dynamic Element (found under More).
A dynamic element filter control is added to the canvas and the Filter Visualizations panel is opened automatically. The filter is already connected to the dynamic hierarchy by default so you can just close the panel.
Switch to View mode from the toolbar and use the filter drop down list to choose the hierarchy you want to see in the table visualization. The filter's token menu can be used to switch the dynamic hierarchy back to its default.
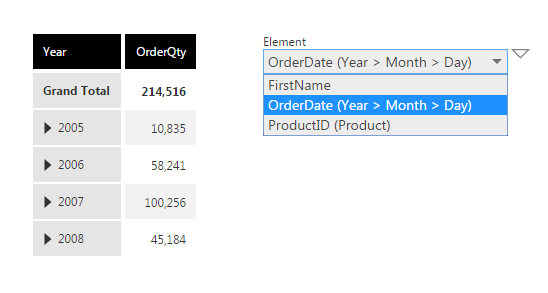
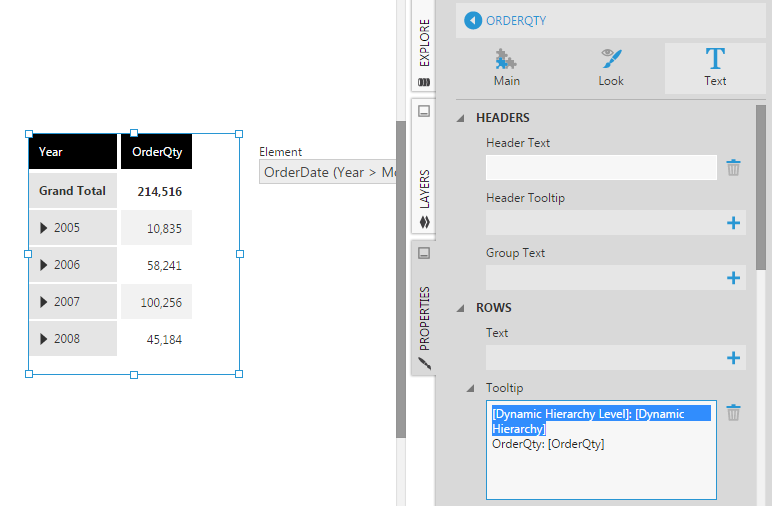
If you hover over a table cell, the tooltip will show the current hierarchy level and corresponding member. This is possible because of special keywords [Dynamic Hierarchy Level] and [Dynamic Hierarchy] which you can see in the Properties for the table column.
5. Properties
This section describes some of the key properties of a dynamic element filter that you can customize in the Properties window.
5.1. Shown elements
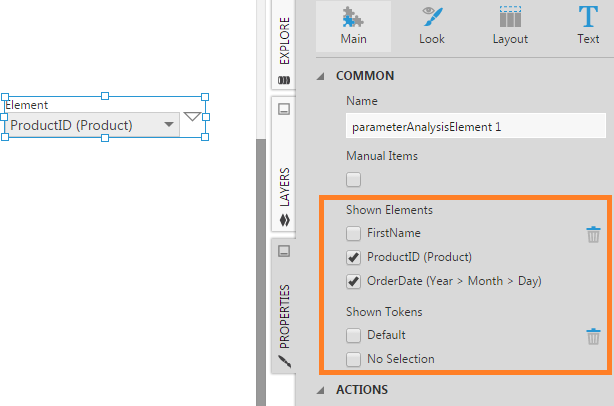
You may want to limit the list of available measures or hierarchies displayed by default in a dynamic filter. Instead of modifying the underlying data cube, you can control exactly which elements will appear in the filter from its Properties.
In the General (or Main) tab, under Filter Values in recent versions, click the + button next to Shown Elements. You'll see a checkbox list of available measures or hierarchies: select the ones you want to appear in the dynamic filter.
5.2. Shown tokens
In a similar way, you can control which tokens you want to display in the filter's token menu via the Shown Tokens property.
If you want to hide the token menu altogether, use the Hide Token Menu option (found in the Look tab in previous versions).
5.3. Label text
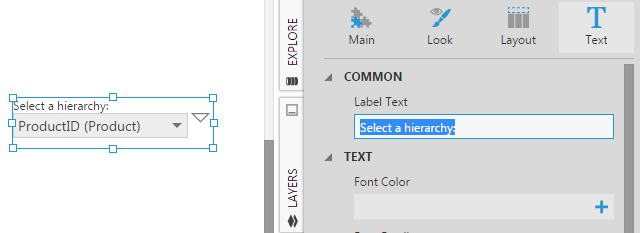
In the Design tab under Font & Text (or the Text tab), use the Label Text property to change the text that appears above the filter's dropdown.
6. Notes
- Dynamic hierarchies and measures are not meant to replace editing a metric set for performing analysis, and have more limited filtering and sorting options. For other limitations, see Product Notes.

