Set up a hover over interaction
1. Overview
This article shows you how to set up a hover over interaction so that a second dashboard is displayed in a popup and filtered accordingly when you hover over a data point on the first dashboard.
Related video: Interactions
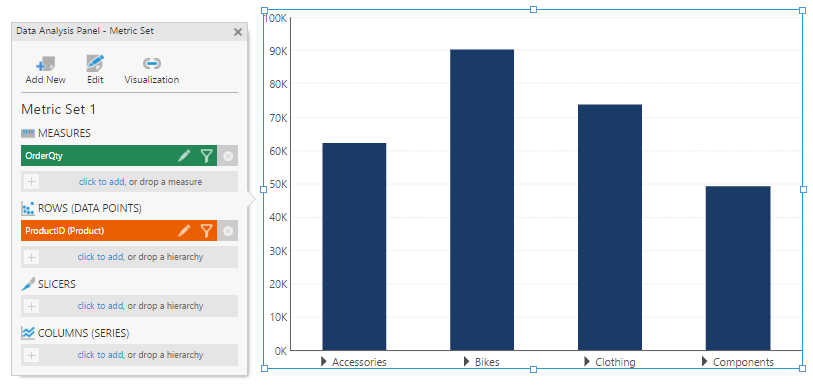
2. Create the first dashboard
Create a metric set and add it to a dashboard in order to show OrderQty by Product.
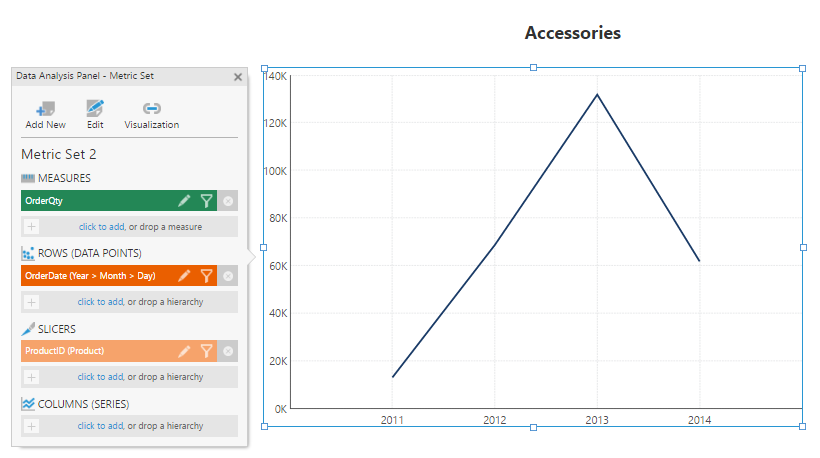
3. Create a second dashboard
Create another metric set and add it to a second dashboard in order to show OrderQty by Date. This dashboard will be displayed in a hover over / popup. The chart in this dashboard is further filtered by Product by adding the corresponding hierarchy under Slicers.
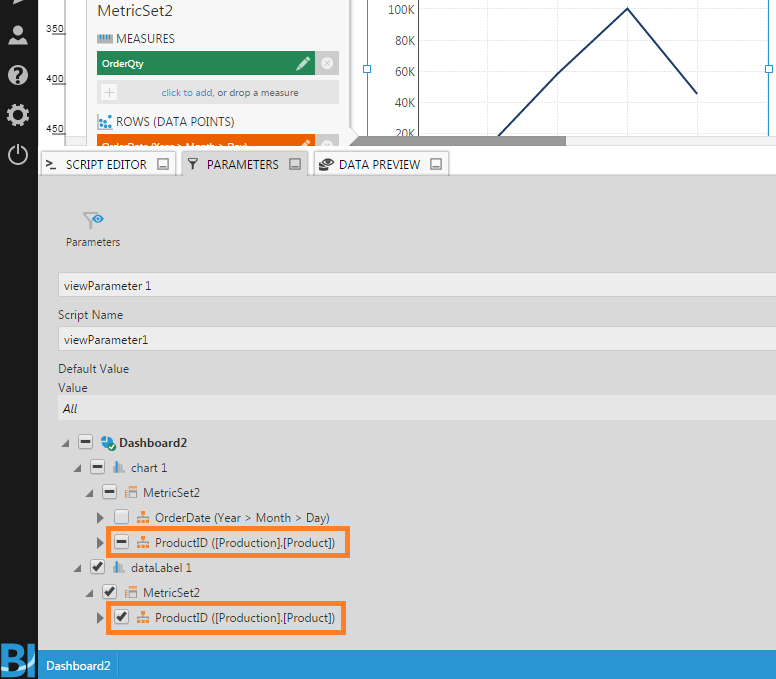
Besides the chart, also add a data label control and drag the second metric set's Product hierarchy onto the data label. This data label will be used to display the slicers (filter) value.
Next, expand the Parameters window which is docked along the bottom of the screen. Click Add New to add a new view parameter and then connect it to the Product hierarchy for both the chart and the data label.
4. Set up the hover over interaction
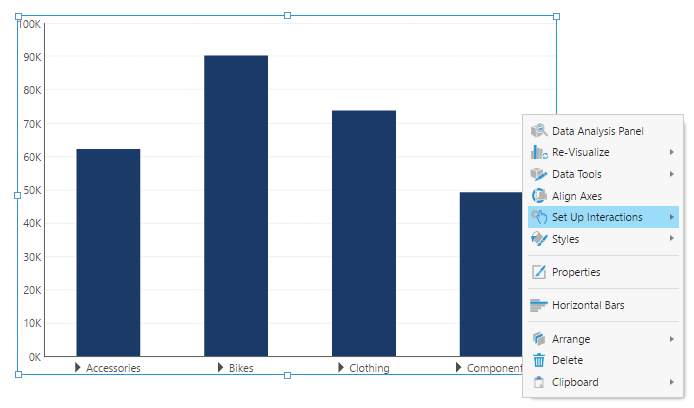
Edit the first dashboard again. Right click over the bar chart and click Set Up Interactions from the menu.
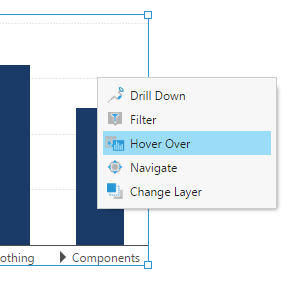
Click Hover Over.
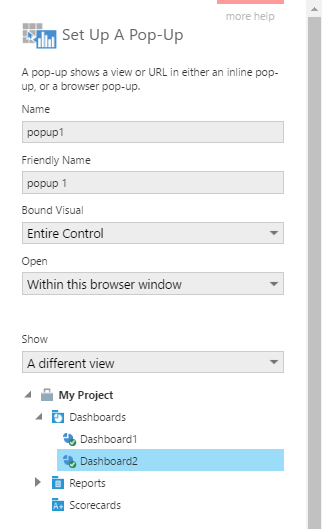
In the Set up a pop-up dialog, select Dashboard 2 as the different view to be displayed on hover-over.
Scroll further down and set the Width (of the popup) to 500 and the Height to 375.
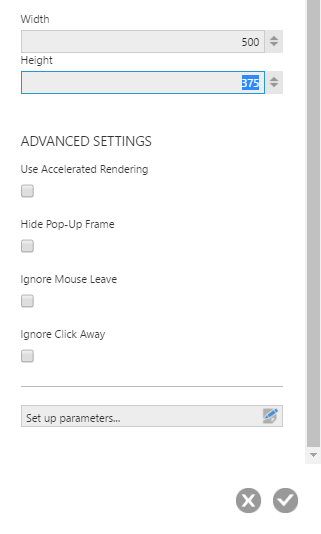
Click Set up parameters.
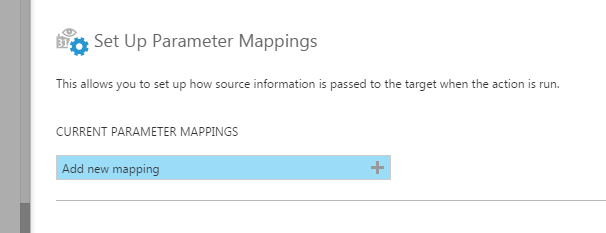
In the Set up Parameter Mappings dialog, click Add new mapping.
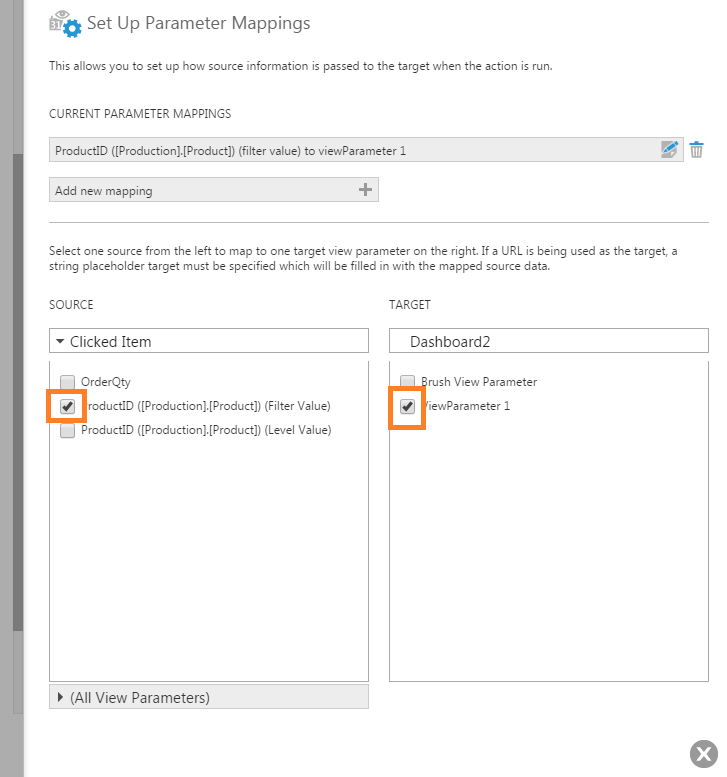
In the Source list, select the ProductID filter checkbox. In the Target list, select viewParameter1. This forms a mapping so that when the user hovers over a data point (Product) on Dashboard 1, the corresponding product value will be passed to the view parameter on Dashboard 2. Since the view parameter is hooked up to the Product slicers hierarchy, the line chart on Dashboard 2 will be filtered accordingly when it is displayed in a popup.
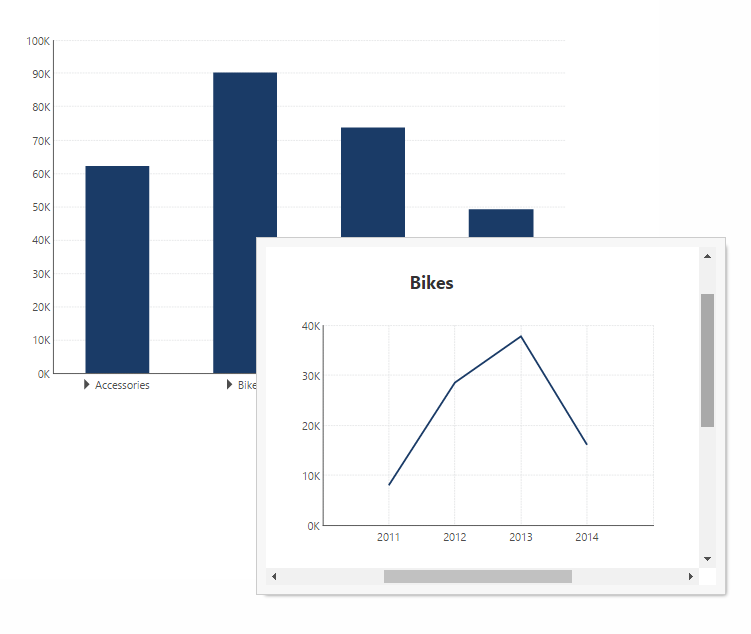
5. Test the interaction
Switch to View mode and hover over a data point (Bikes product) on Dashboard 1. You should see Dashboard 2 displayed in a popup that shows OrderQty by Date filtered by the product in question.