
1. Overview
This article shows you how to set up a navigate interaction so that when you click on a data point, the current view is replaced with a second view such as a dashboard showing filtered data corresponding to the clicked data point. You can also set up navigation on any component such as buttons or images.
You can navigate to any type of view, including dashboards, reports, scorecards, and small multiples, or to any webpage via its URL, and optionally pass information about what data was clicked as a parameter. Passing parameters to a URL is shown in the article Navigate to URL.
Related video: Interactions
2. First dashboard
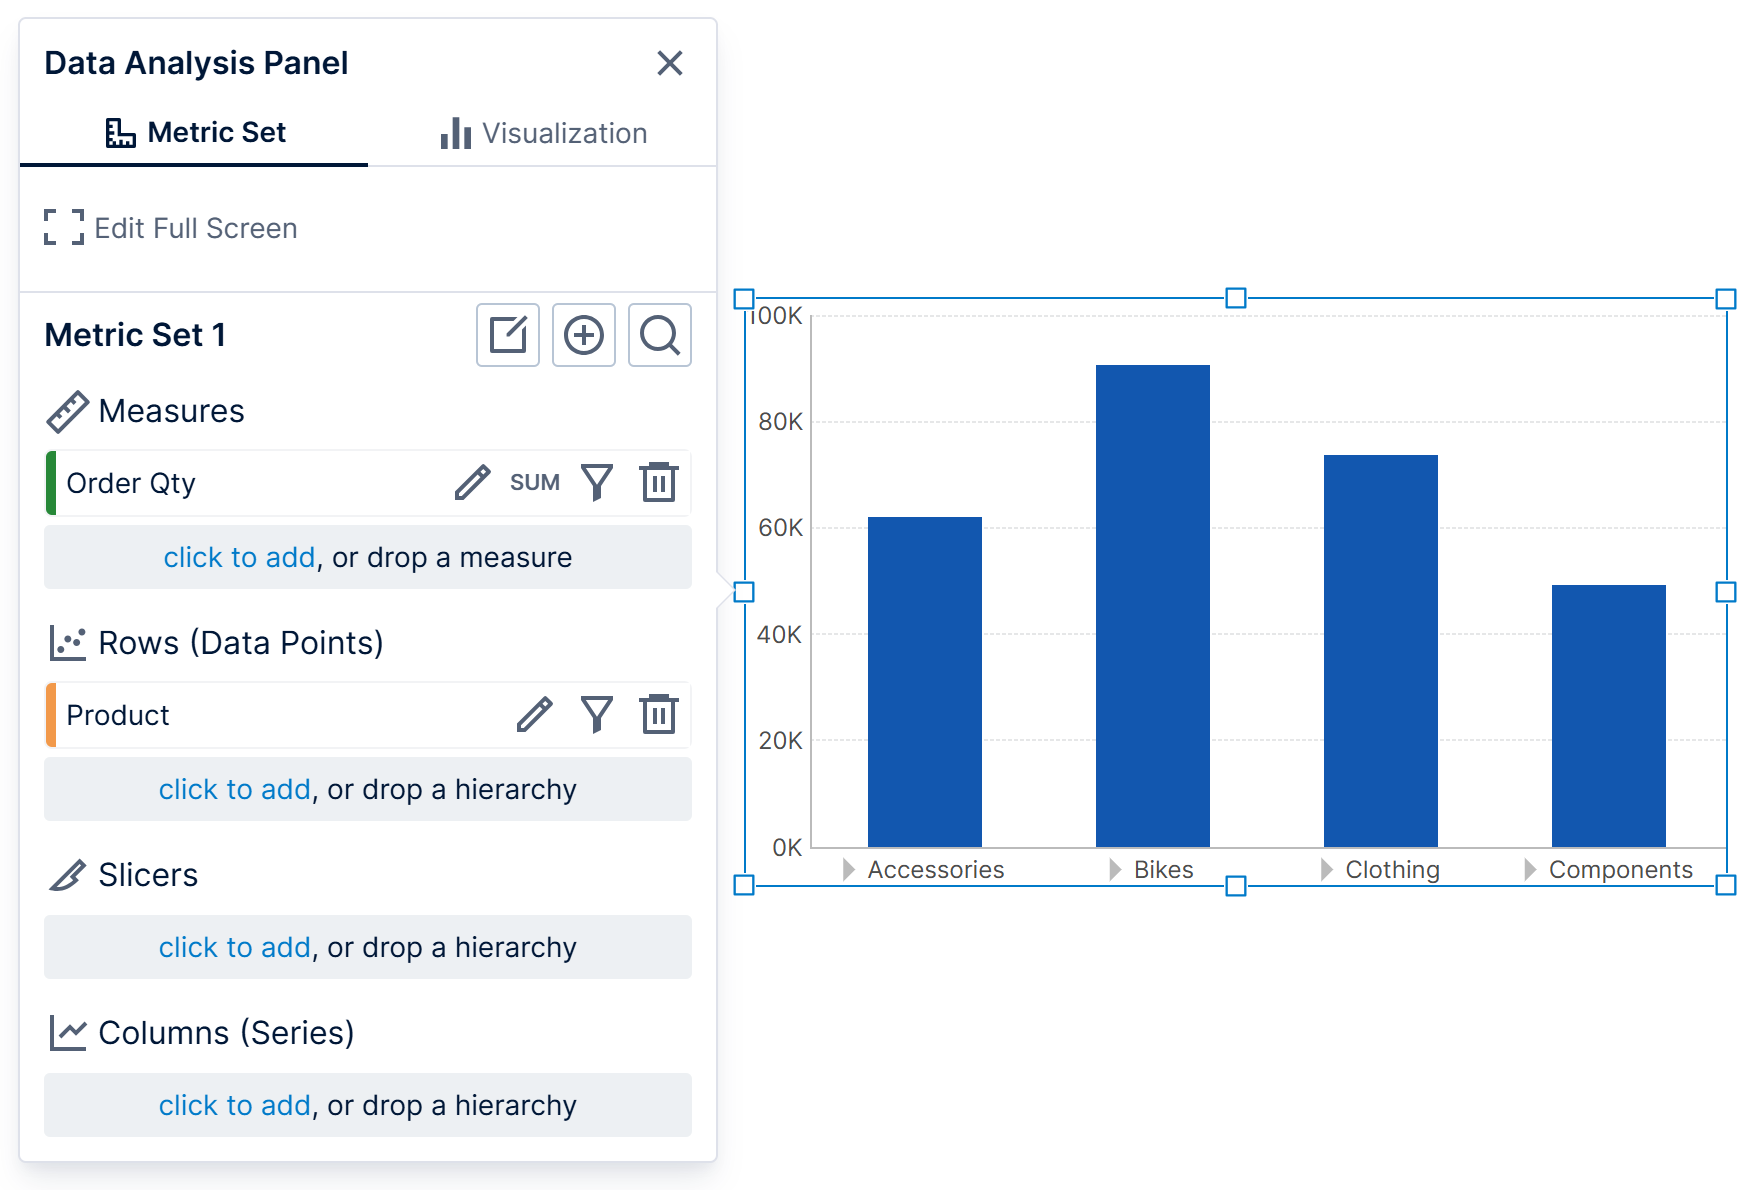
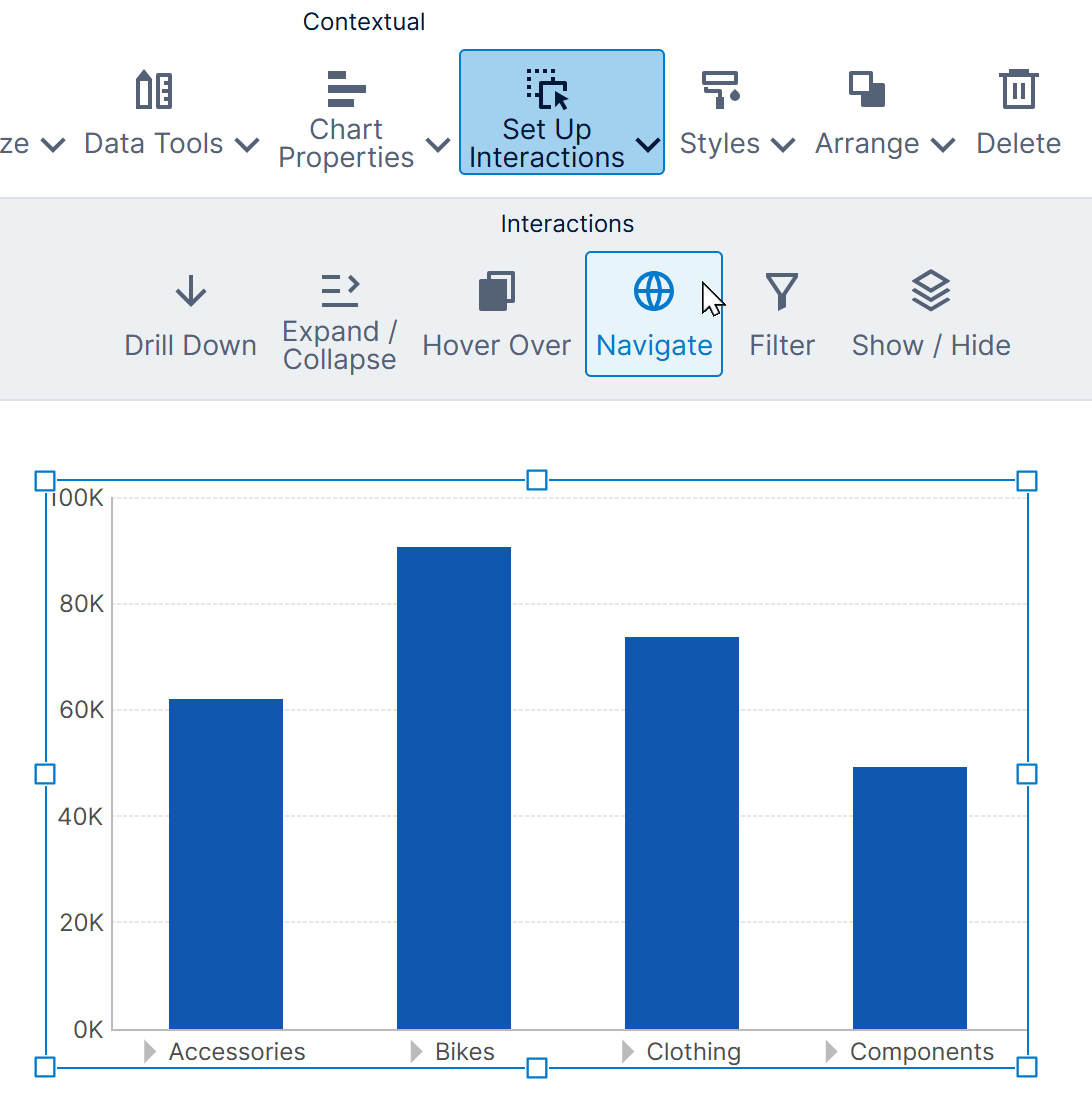
On our first dashboard, we are showing Order Qty by Product in this example.
3. Second dashboard
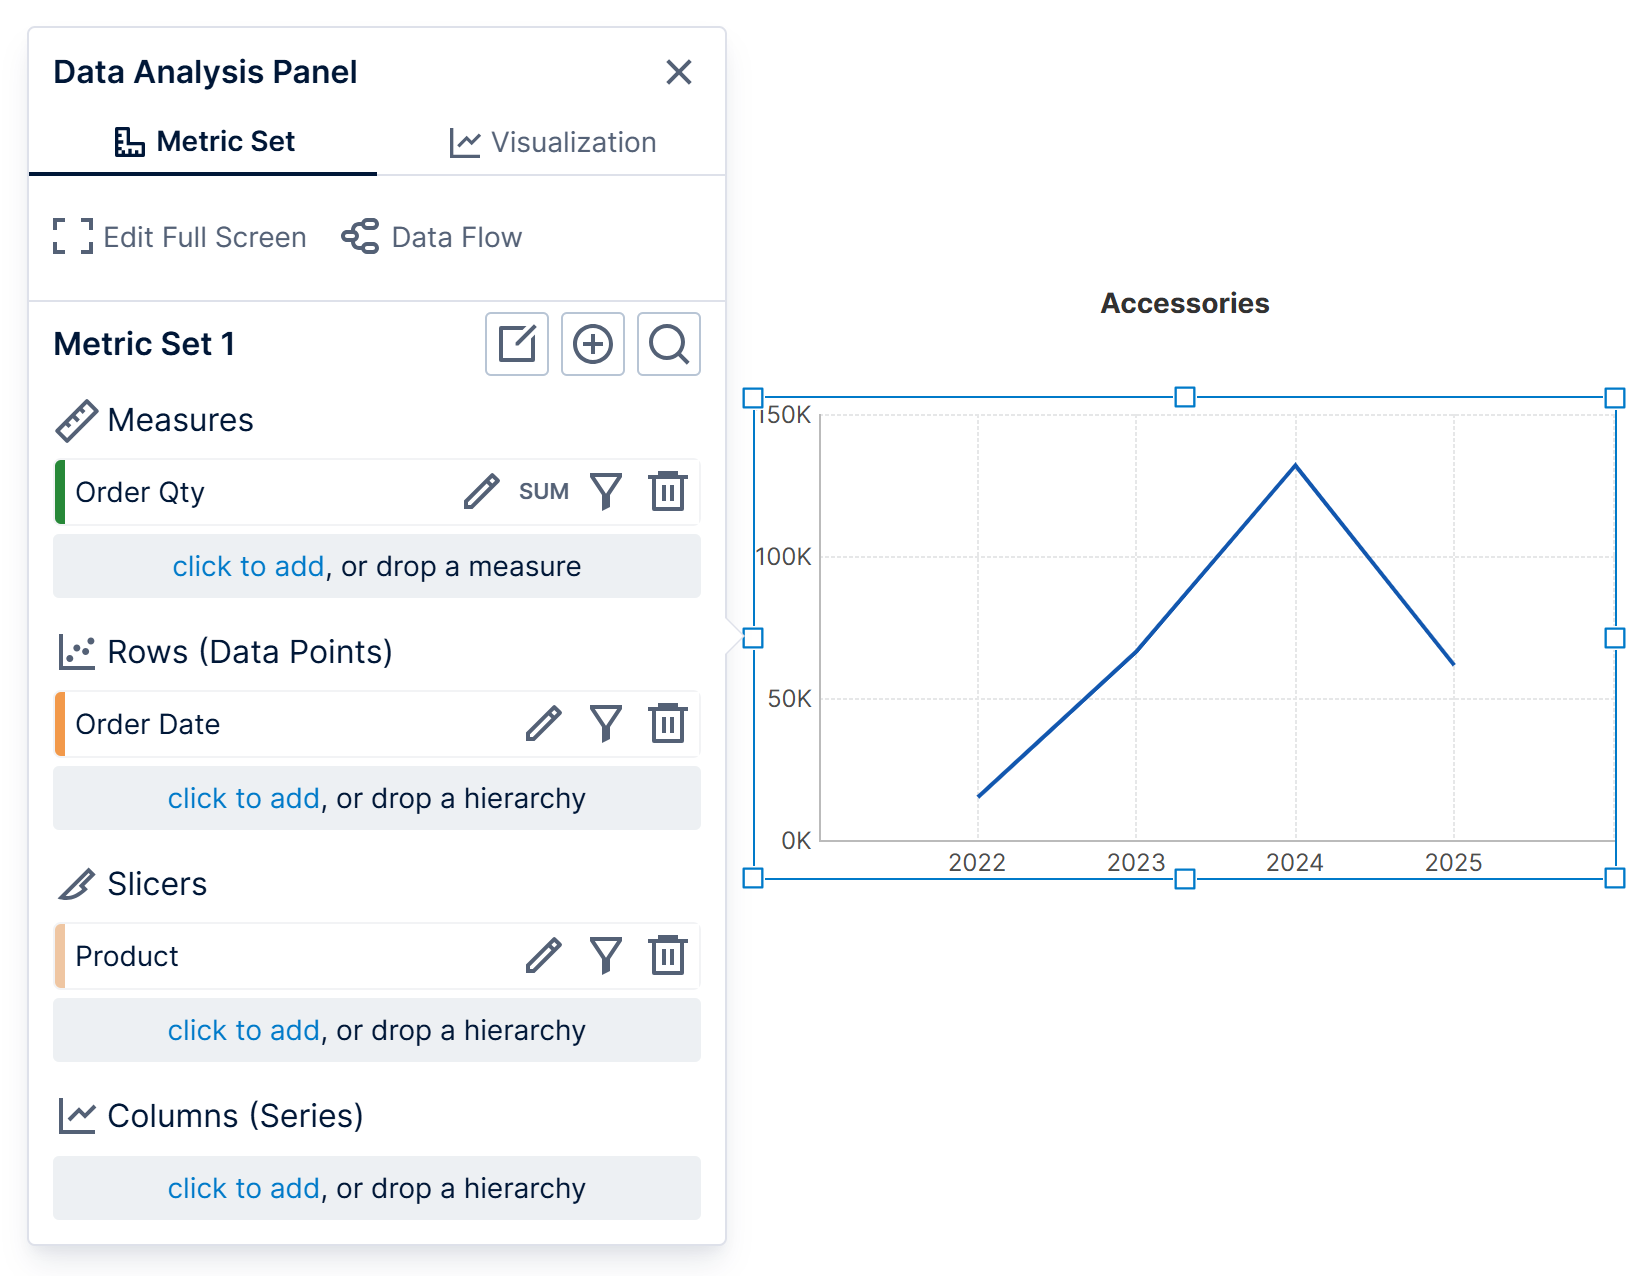
On our second dashboard, which we want to navigate to from the first one, we are showing Order Qty by Date in this example.
To be able to display details specific to a data point that was clicked on in the first dashboard, we also:
- Added Product under Slicers in the Data Analysis Panel for the chart, so that we can filter by the product clicked on in the first dashboard.
- Added a data label to the dashboard, and dragged the same Product hierarchy dragged onto it, so we can display the product clicked on in the first dashboard.
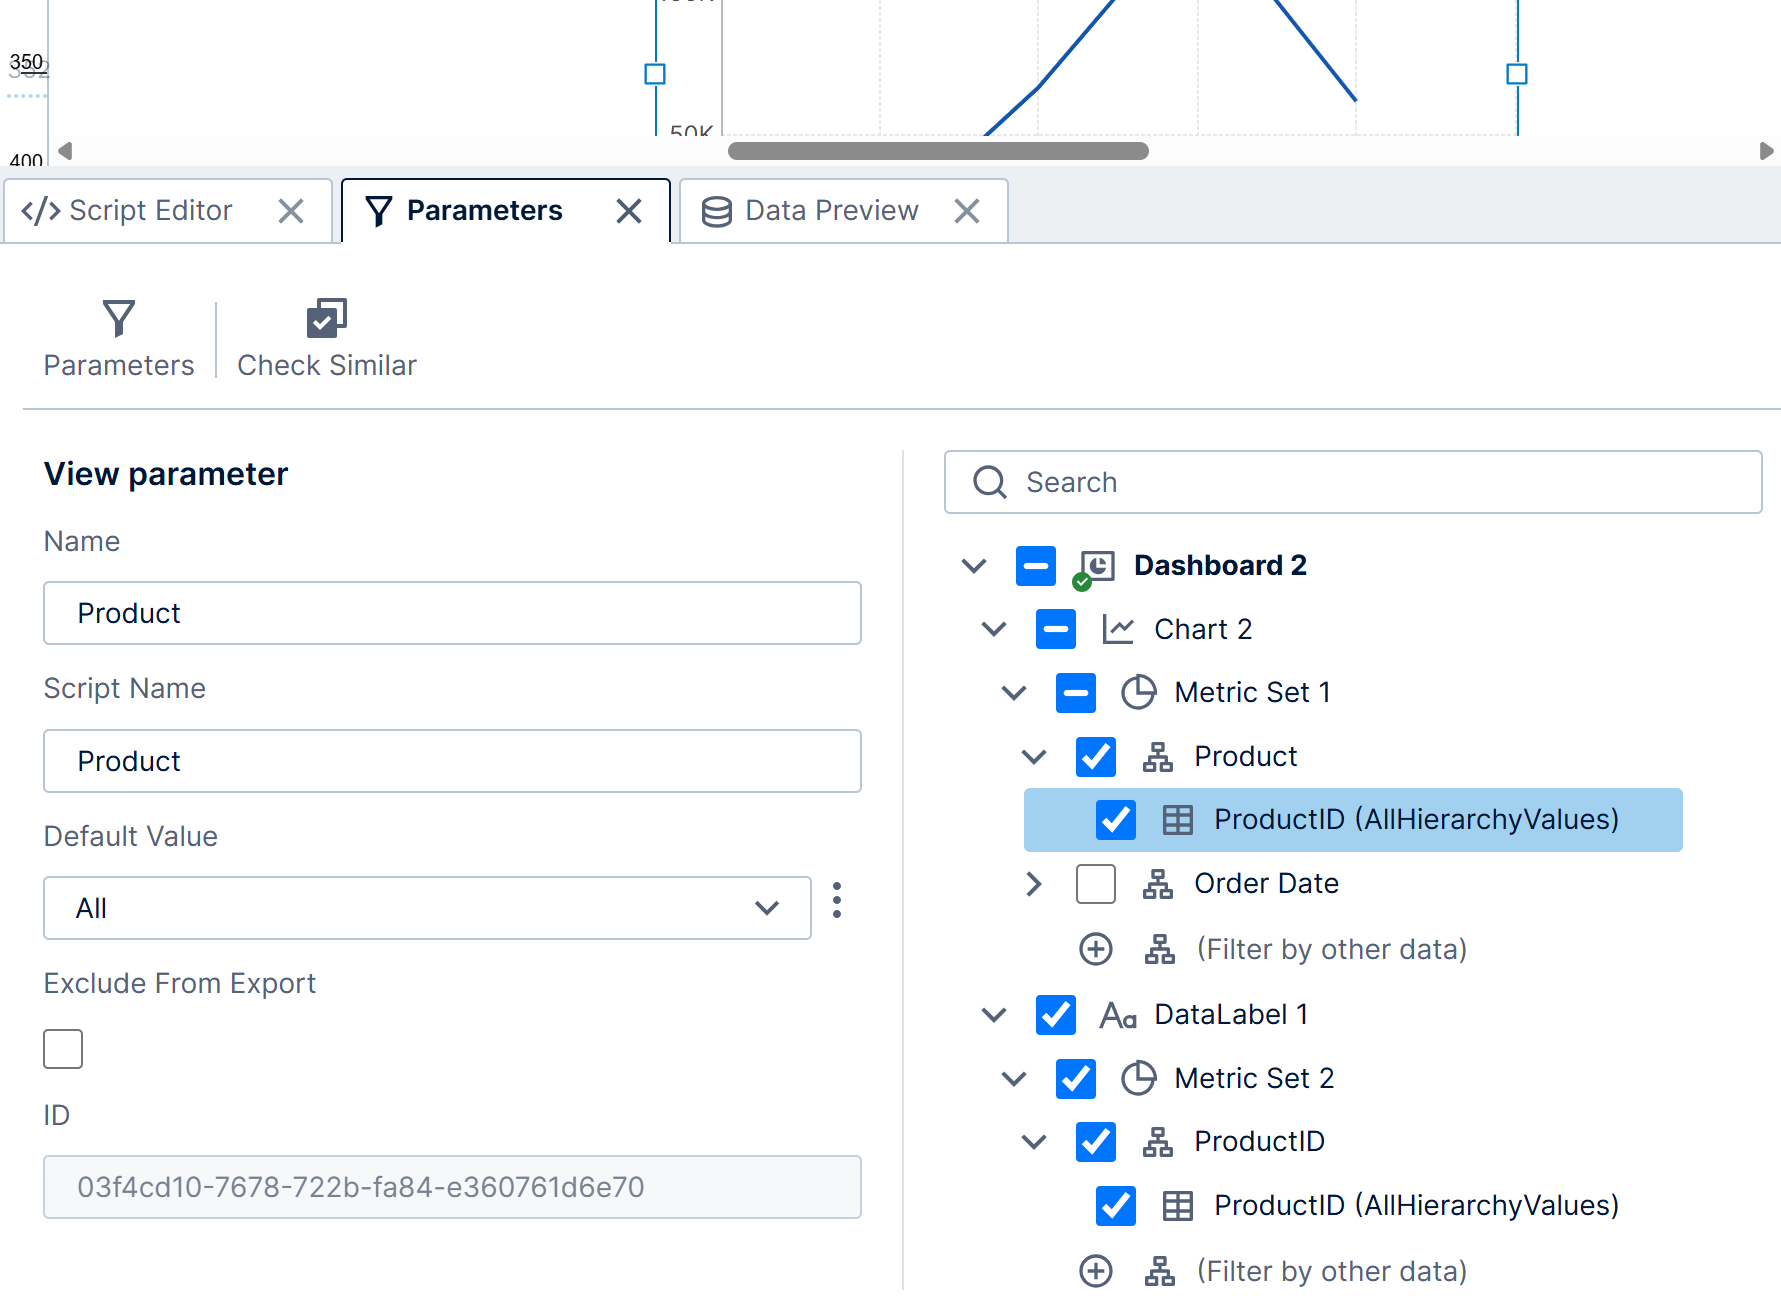
Next, expand the Parameters window, which is typically docked along the bottom of the screen.
Click Add New to add a new view parameter, and then connect it to the data to be filtered. In our example, this is the Product hierarchy for both the chart and the data label.
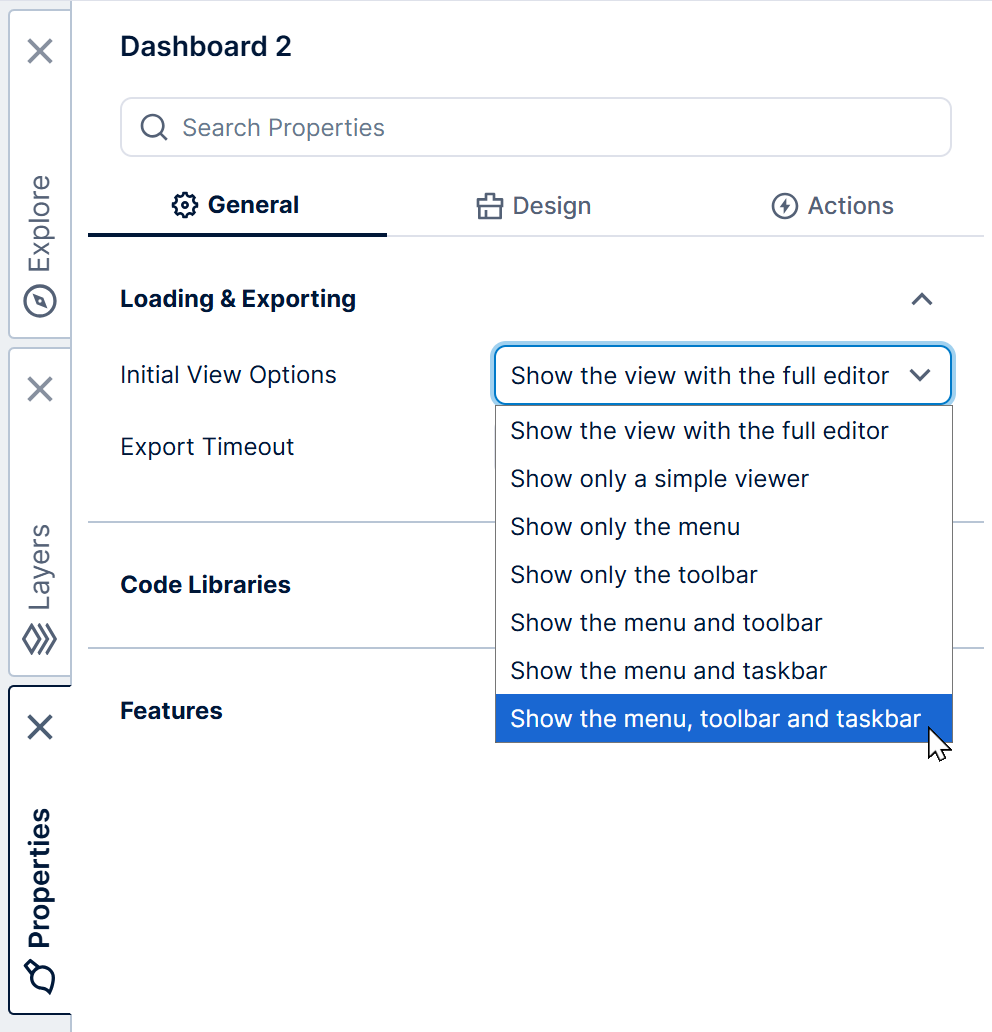
In this example, we will set the initial view options on the dashboard and use these in the interaction (this is optional).
Click an empty area of the canvas to de-select the visualization, and in the Properties window under Loading & Exporting in recent versions, we set Initial View Options to Show the menu, toolbar and taskbar.
4. Set up the navigate interaction
While editing the first dashboard with the chart selected, click Set Up Interactions and then Navigate in the toolbar or right-click menu.
In the navigate interaction dialog:
- Set Navigate where you want to go. In this example, we choose To a different view such as another dashboard or a report.
- Set Open where you want the content to open. In this example, we choose In the same window.
- Optionally select Use Target Initial View Options if you set up initial view options in the target dashboard as shown in the previous section and want to use them.
When navigating to a different view, an expandable list of views is displayed for you to select one. We select Dashboard 2 in our example.
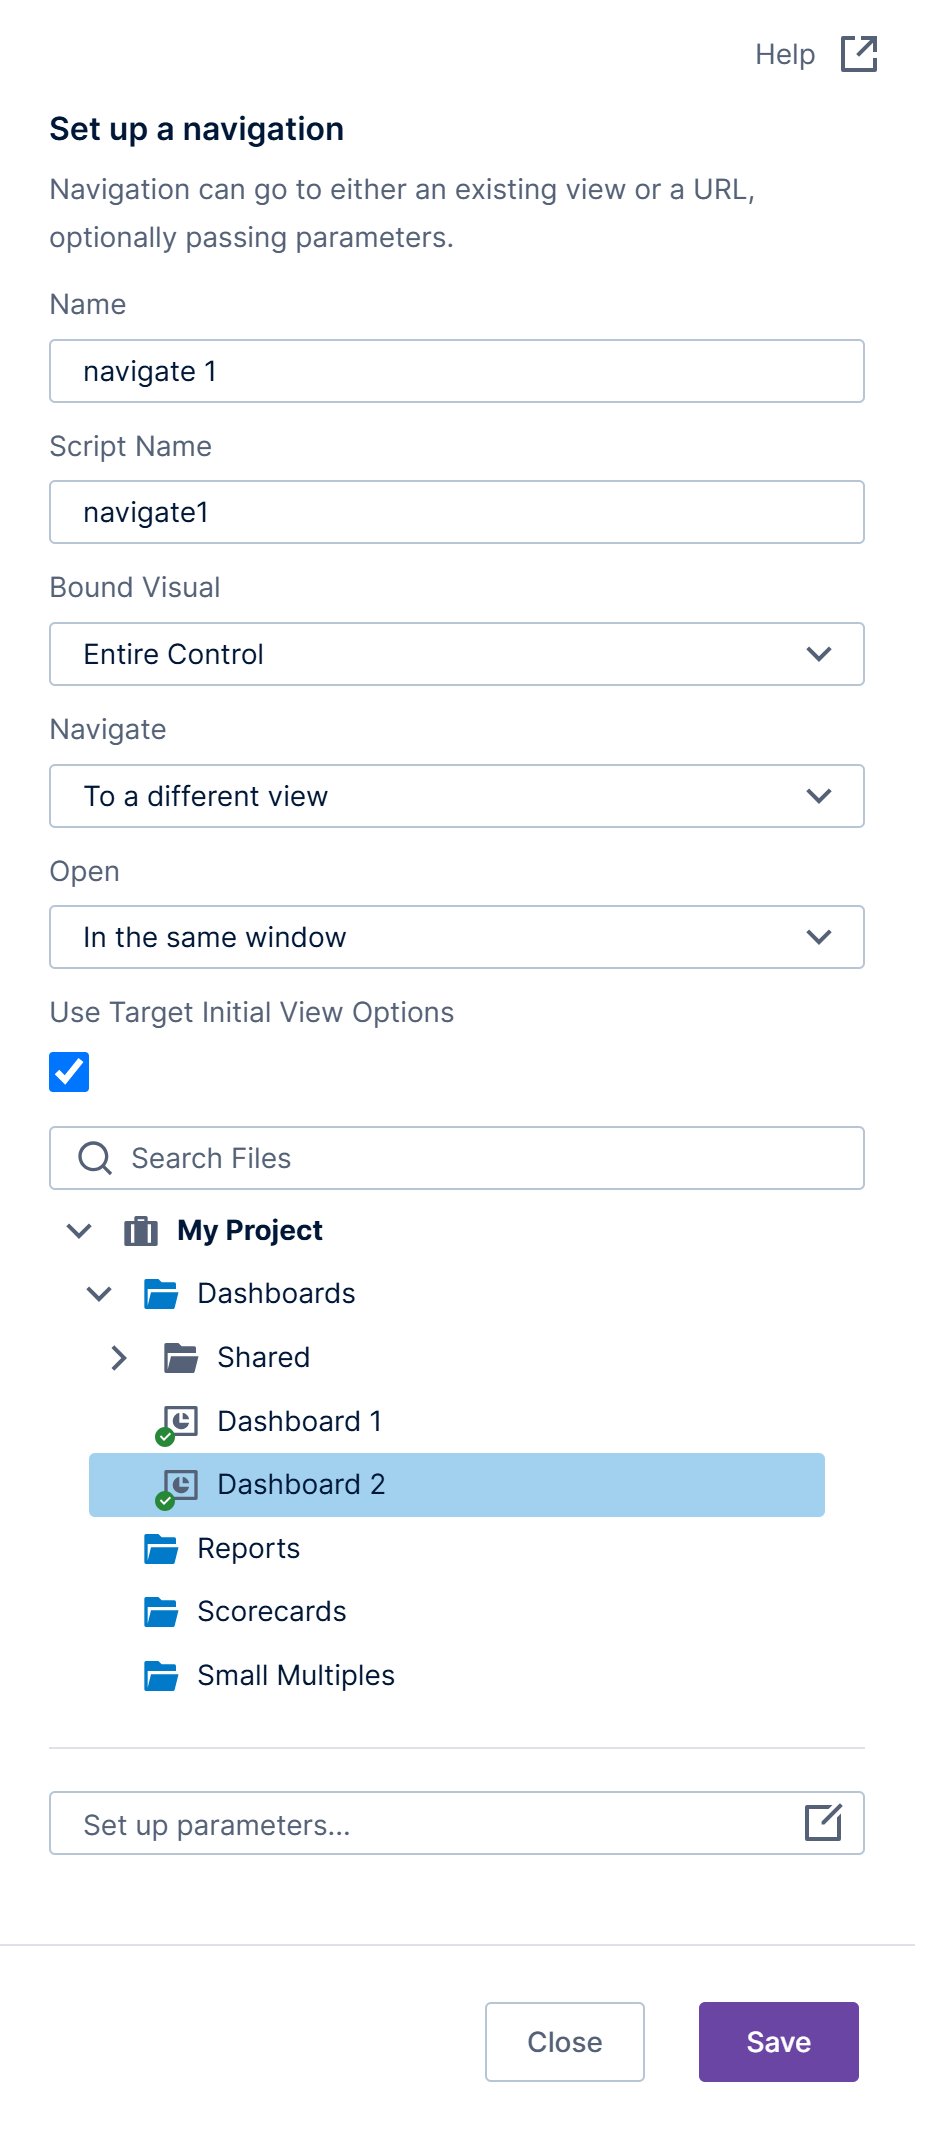
At the bottom of the dialog, click Set up parameters when you want to pass a parameter value, to filter data in the target view, for example.
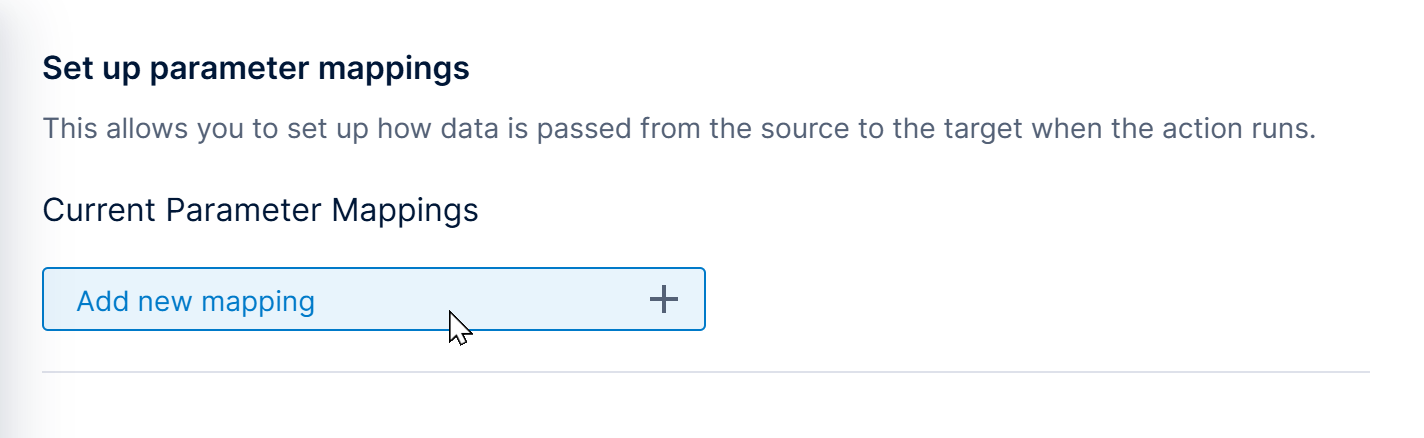
In the parameter mappings dialog, click Add new mapping.
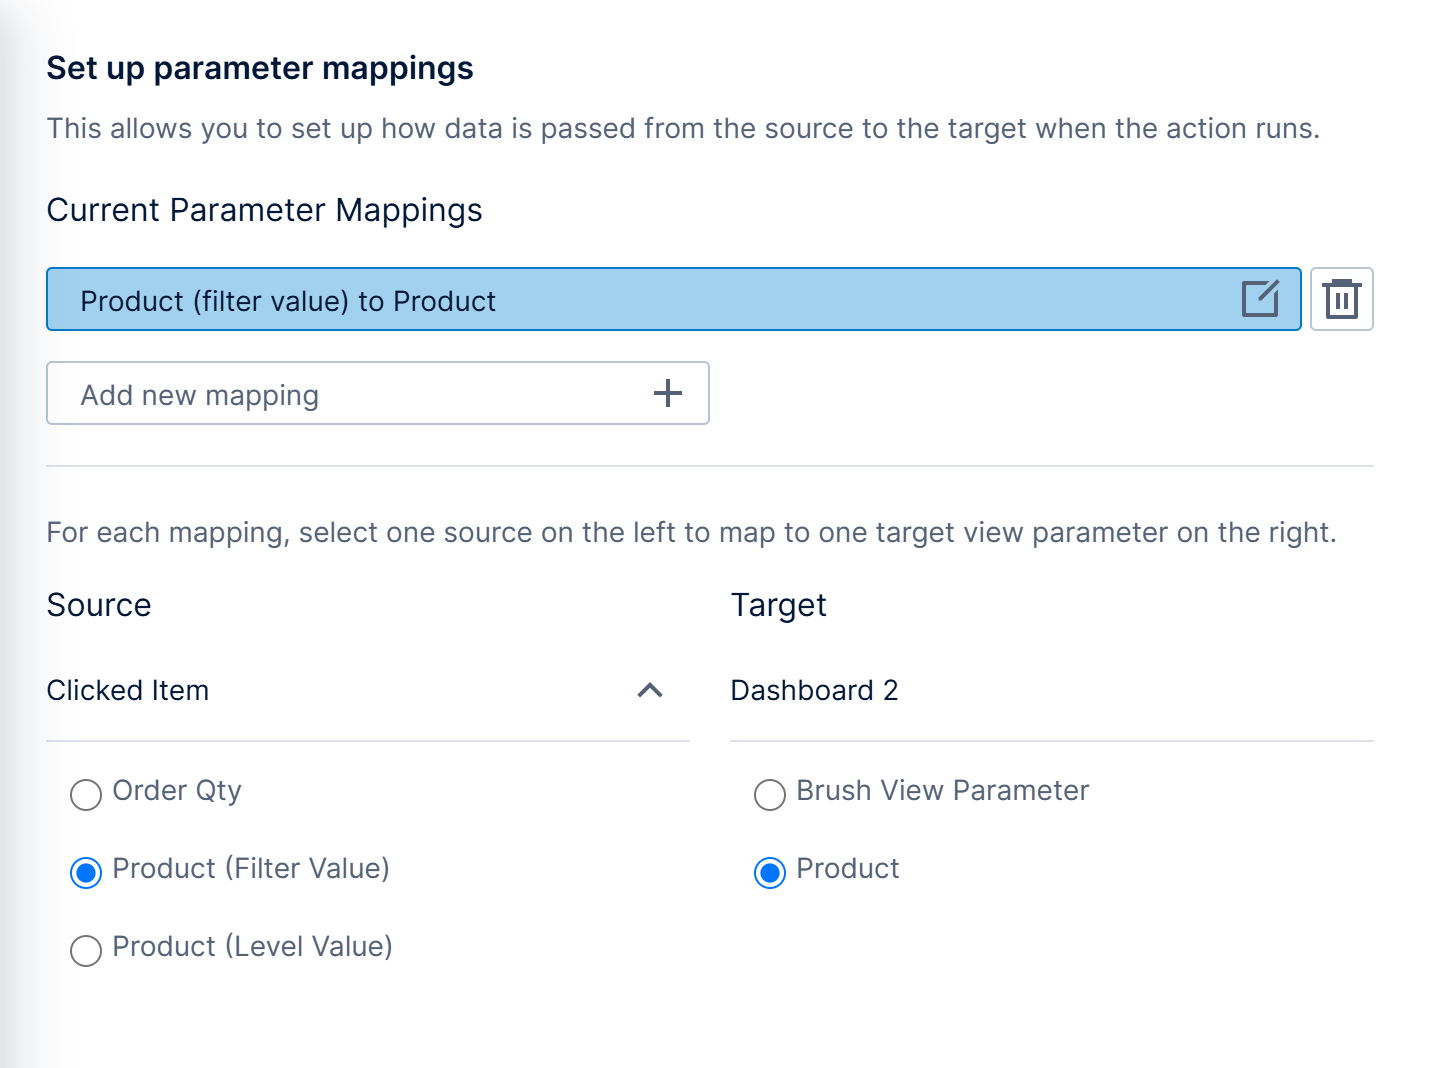
- Under Source, select a data value to pass. This is Product (Filter Value) in our example.
- Under Target, select a view parameter in the target dashboard that corresponds with the passed value. In our example, we typed in the name Product for our view parameter in the second dashboard that we connected to product data.
5. Add another navigate interaction to go back
You can optionally add another interaction that navigates from the target dashboard back to the original.
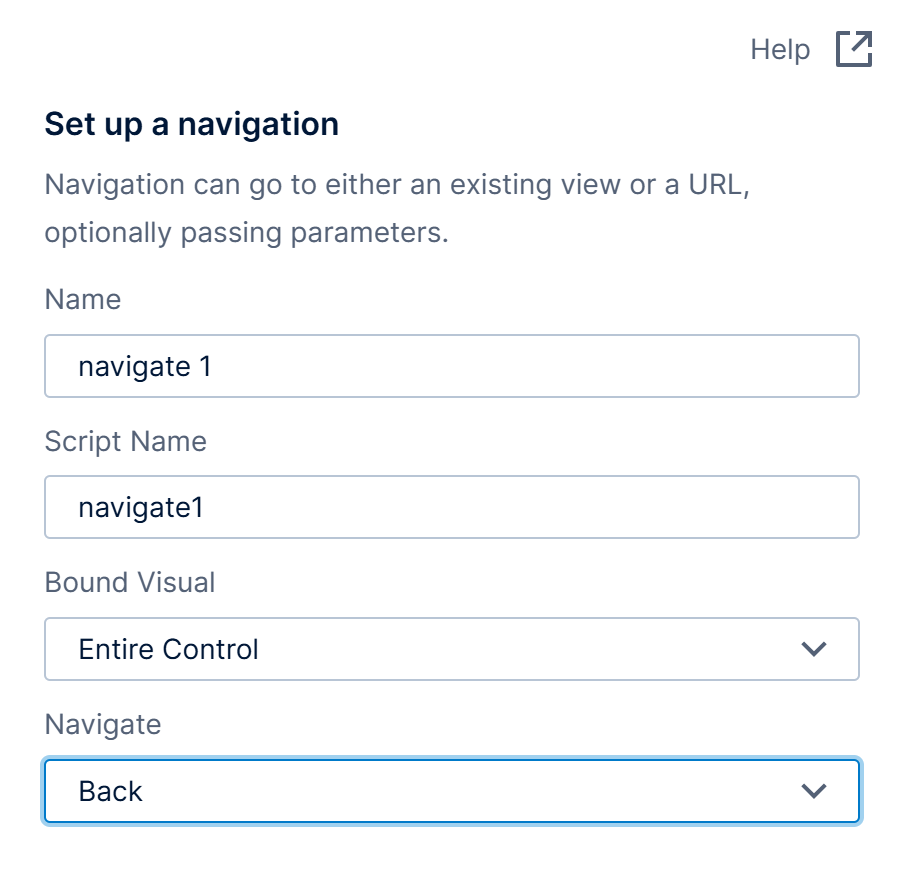
Editing the second dashboard, set up a navigate interaction on the chart or on a new component such as a button, setting Navigate to Back.
6. Test the interaction
Viewing the first dashboard, clicking a data point such as Bikes brings us to the second dashboard filtered by the value that was clicked on.
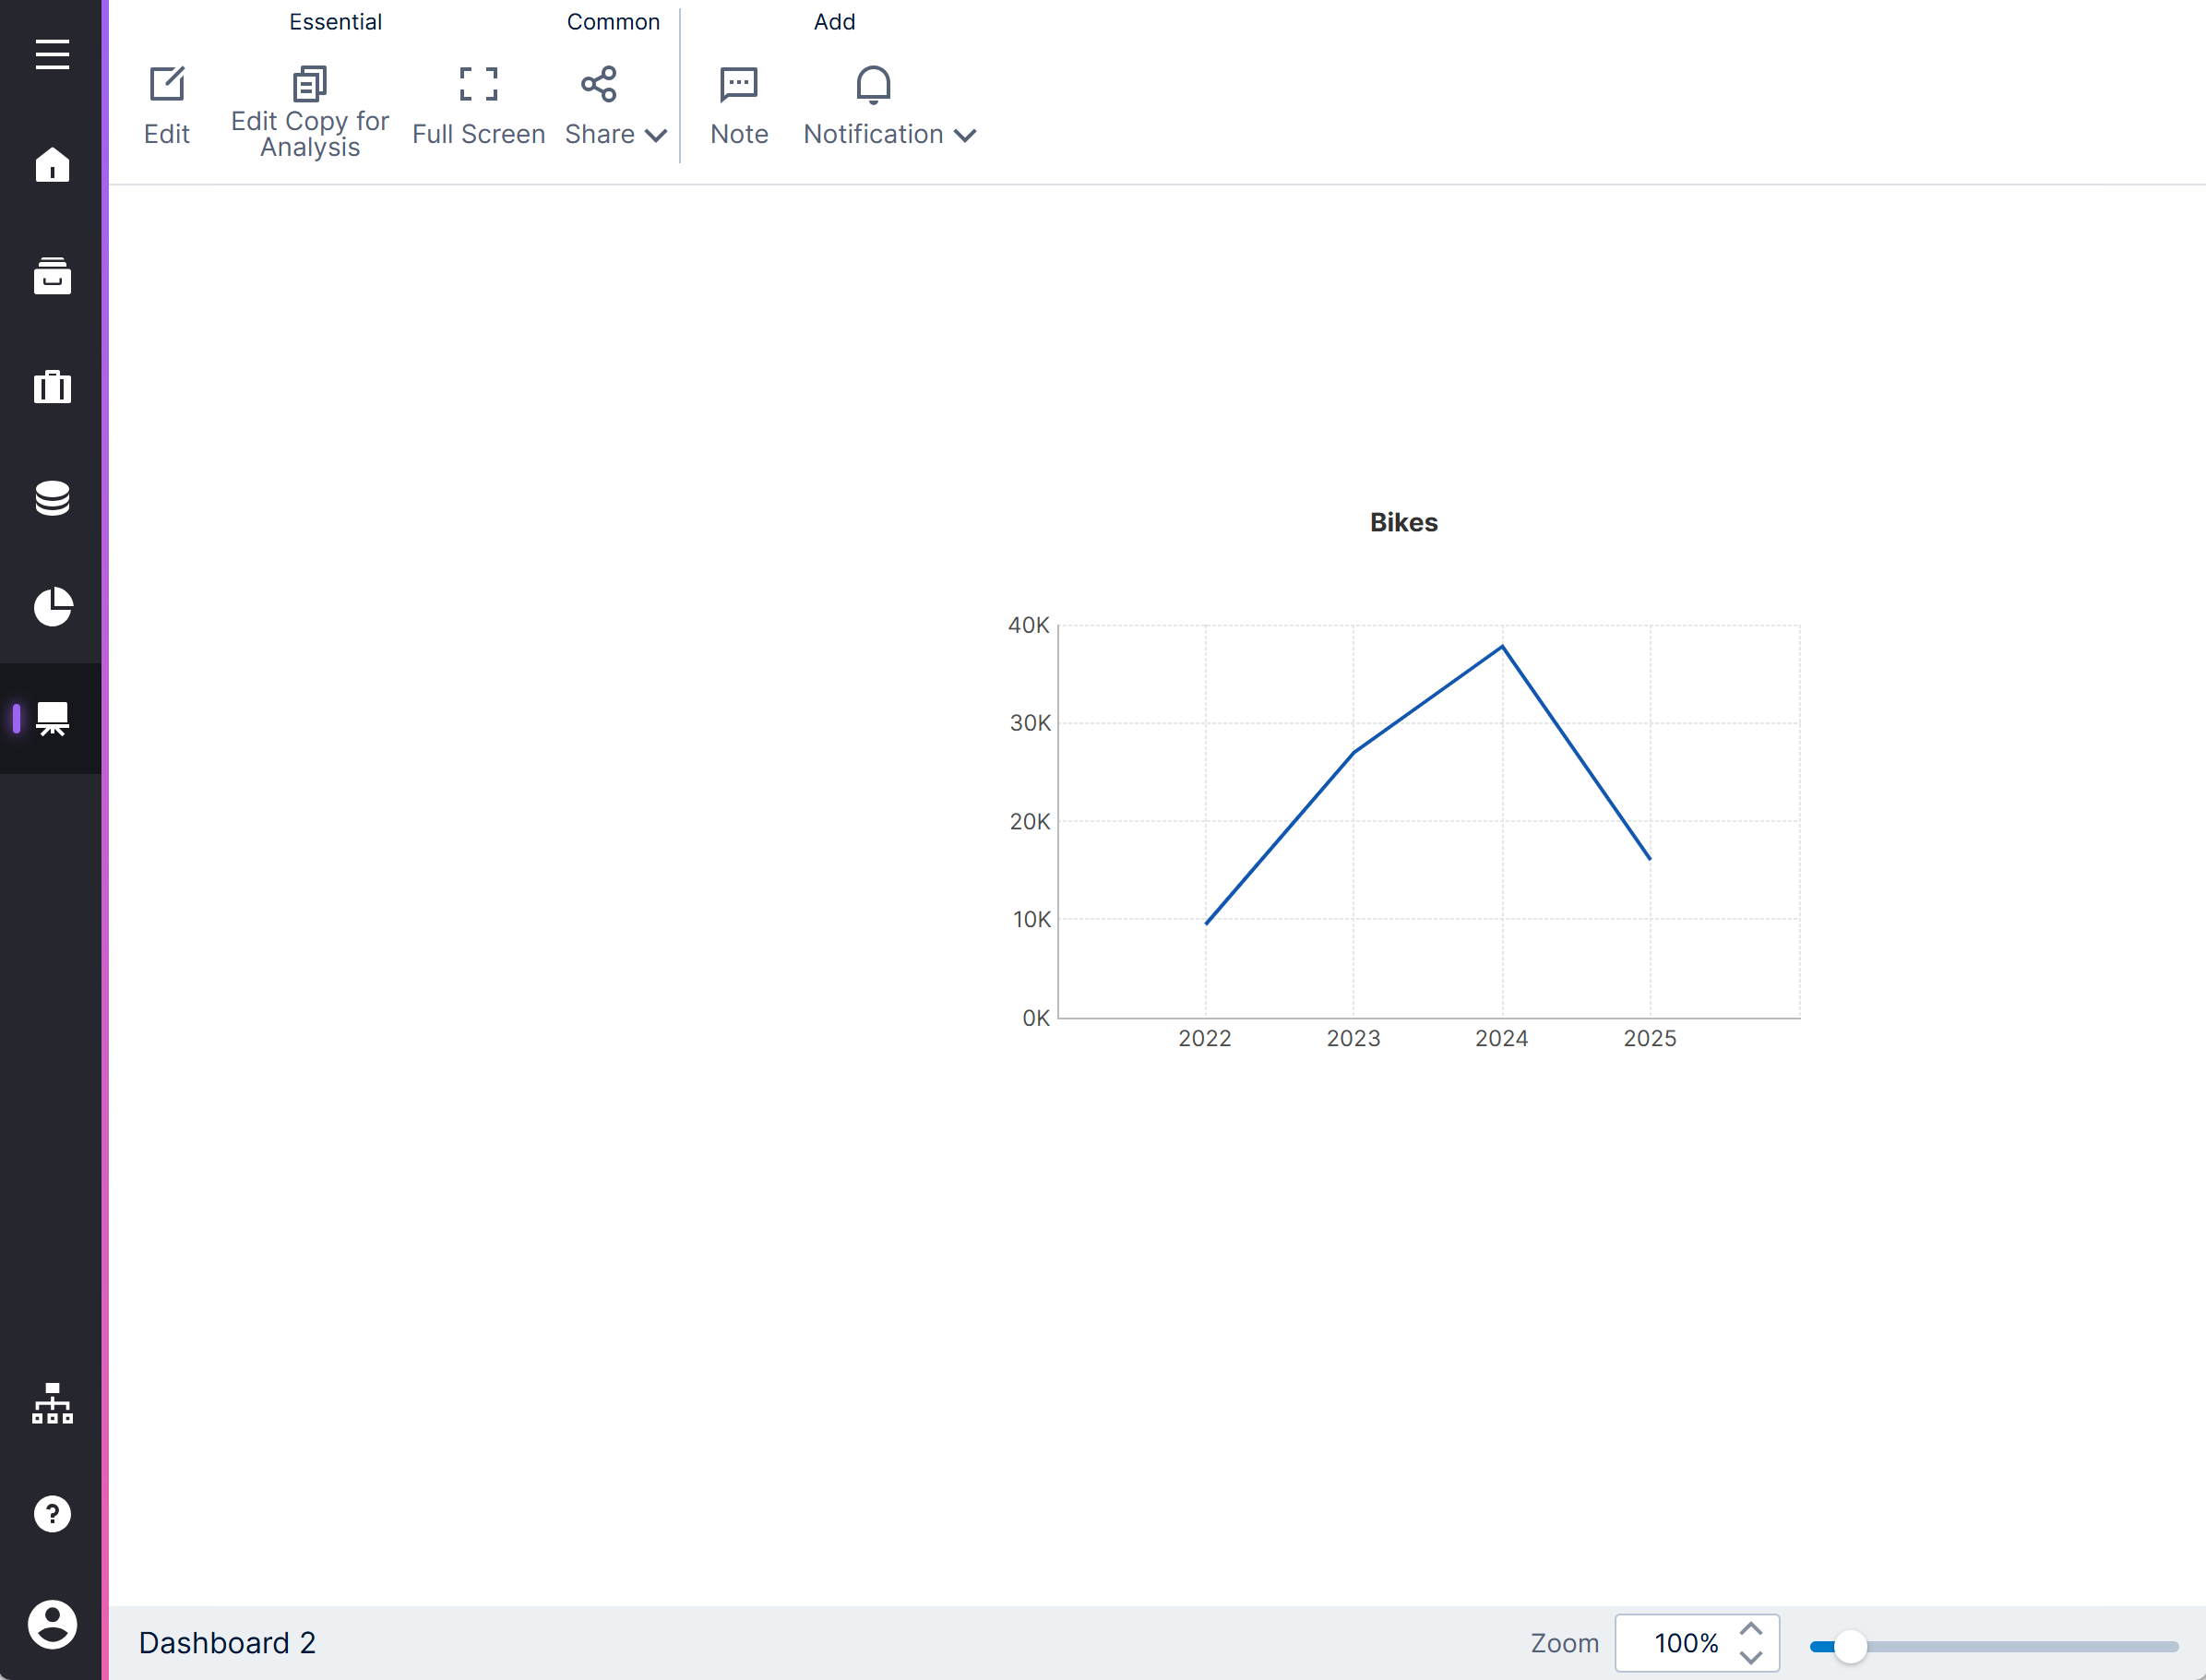
In our example, dockable windows are not visible because we set this up as our initial view options.
If a second interaction was set up to go back on some part of the second dashboard, we can click there now to return to the first dashboard.