
1. Overview
A drill down interaction lets you navigate one level down in a hierarchy when you click or tap a data point, and filters to the data points that make up the one you selected. For example, you could drill down on the year 2012 to view data broken down by each of its months.
This article shows a basic example of how you can set this type of interaction up to happen on a single click of a data point.
Related video: Interactions
2. Create a dashboard
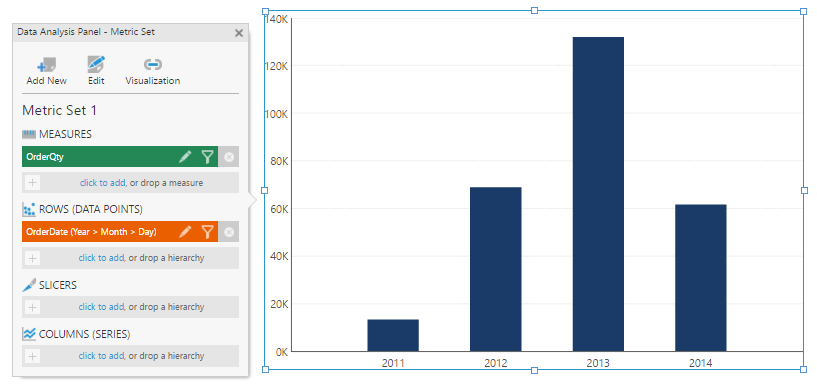
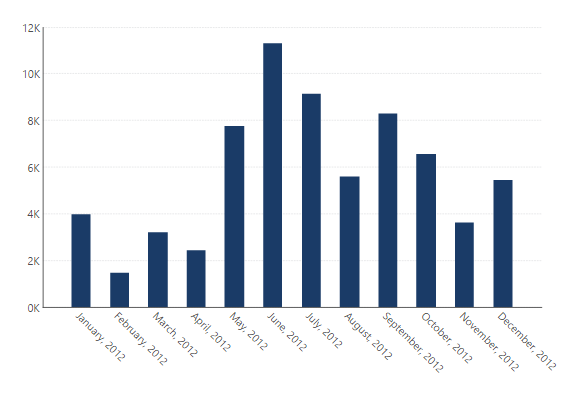
First, create a metric set and add it to a dashboard in order to show OrderQty by Date as an example.
3. Set up the drill down interaction
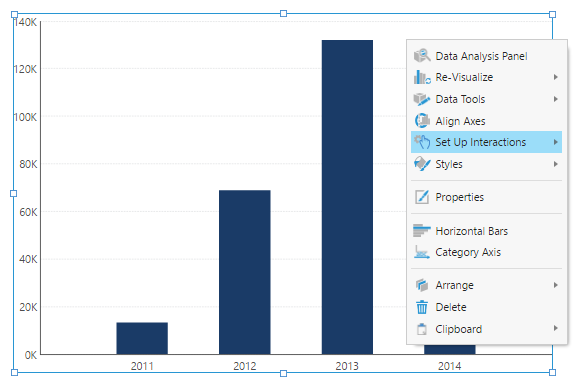
Right-click (or long-tap) over the bar chart on the canvas and select Set Up Interactions.
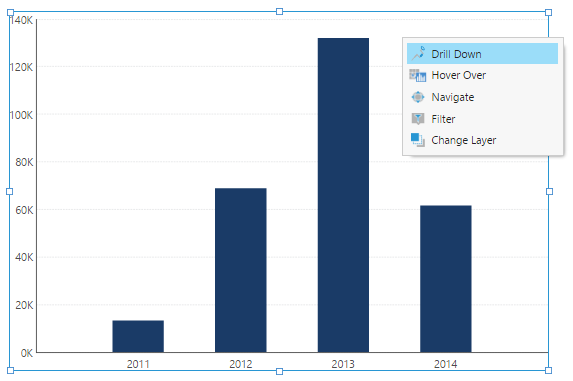
From the submenu, select Drill Down.
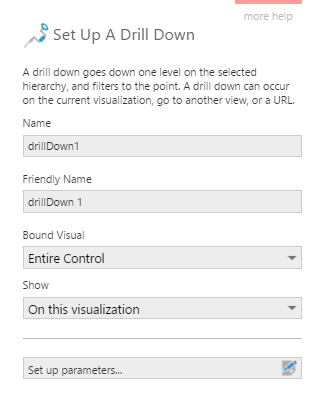
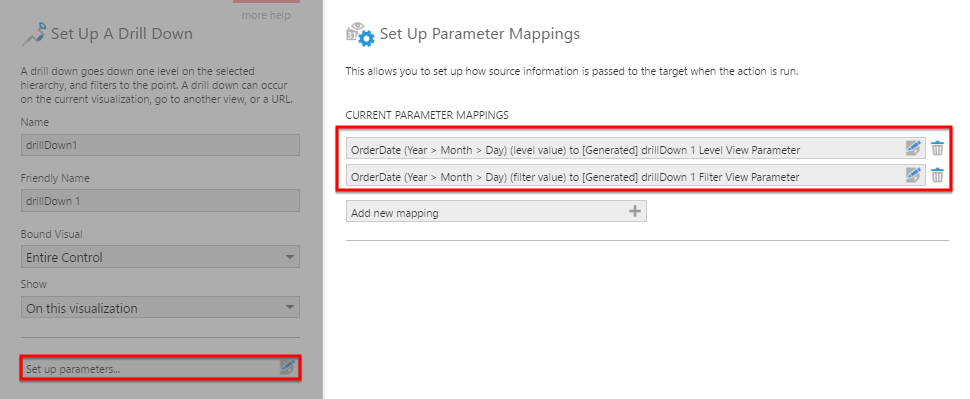
In the Set up a Drill Down dialog, you can leave the default settings and submit the dialog, but for this example we are first going to look at the settings Dundas BI applied automatically. Click Set up parameters before continuing.
In the Set Up Parameter Mappings dialog, you'll see that two mappings have been added automatically for changing the level and then filtering to the data selection. This is where you can choose which hierarchy is filtered and changed down a level, but no further steps are needed right now. Just close this dialog to return to the Setup dialog and click Submit.
4. Test the interaction
Click View in the toolbar, and click a data point (Year 2012) on the bar chart. You should see the level change to Month and the data filtered to 2012.
To drill back up, you can use the browser Back button while the page remains open, right-click (long-tap) options such as Drill Up, or corresponding filters if they were added to the view.