1. Overview
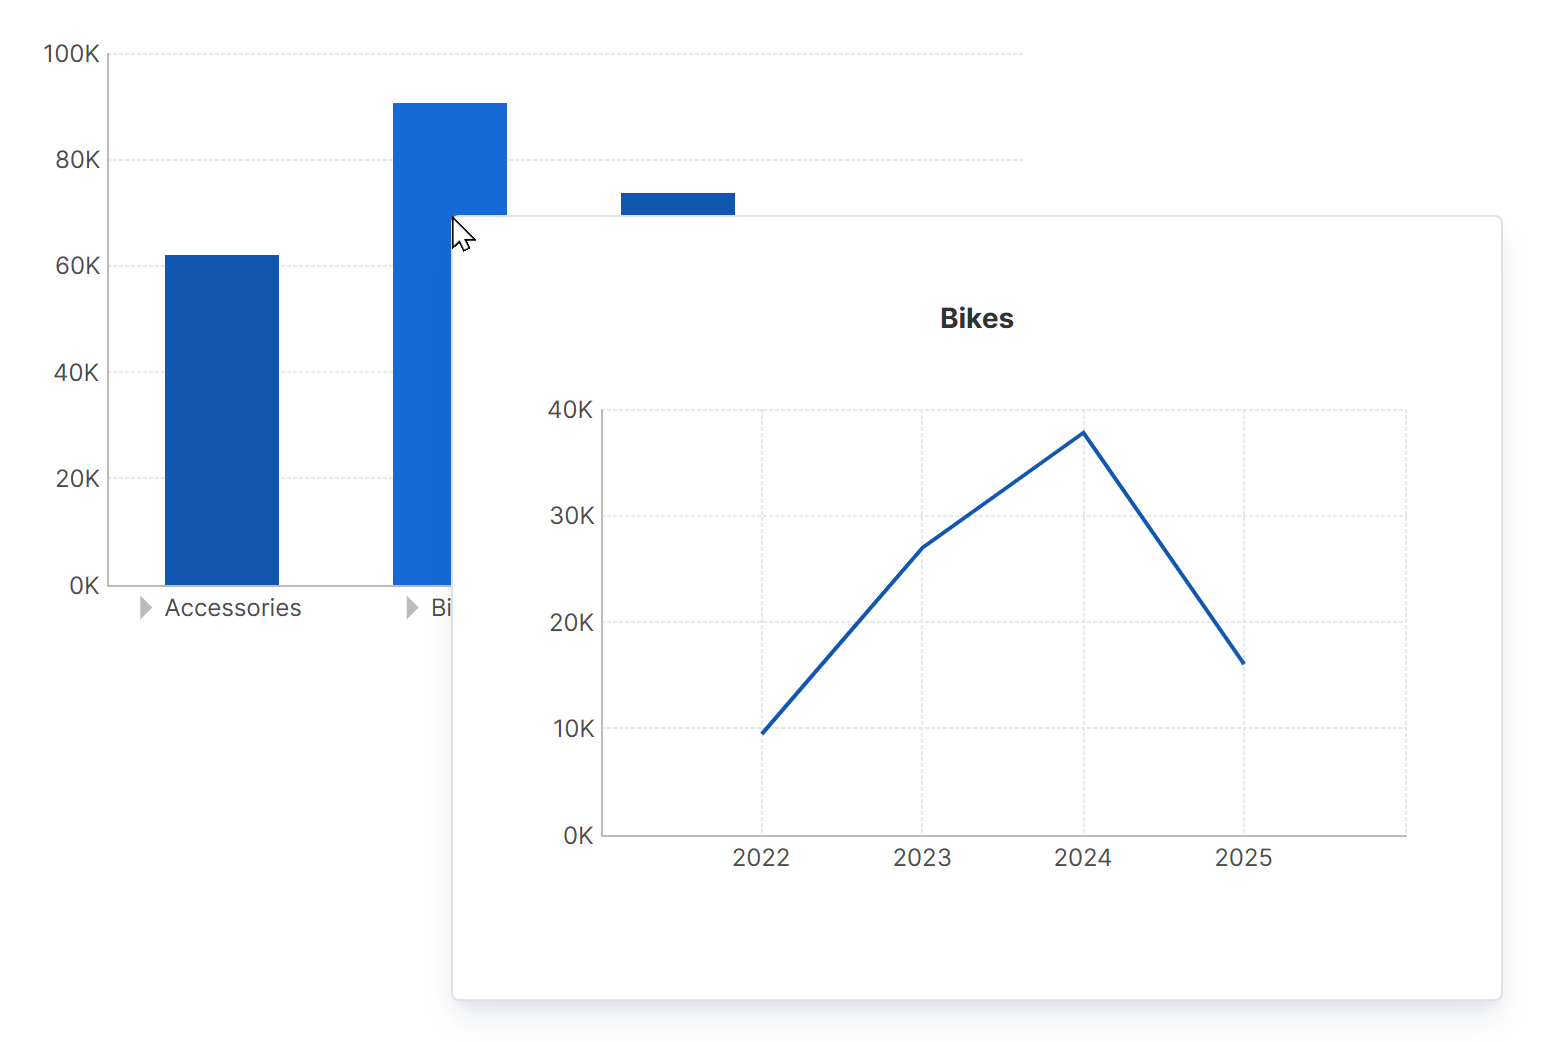
This article shows you how to set up a hover over interaction so that a second dashboard is displayed in a pop-up and filtered accordingly when you hover over a data point on the first dashboard.
Related video: Interactions
2. First dashboard
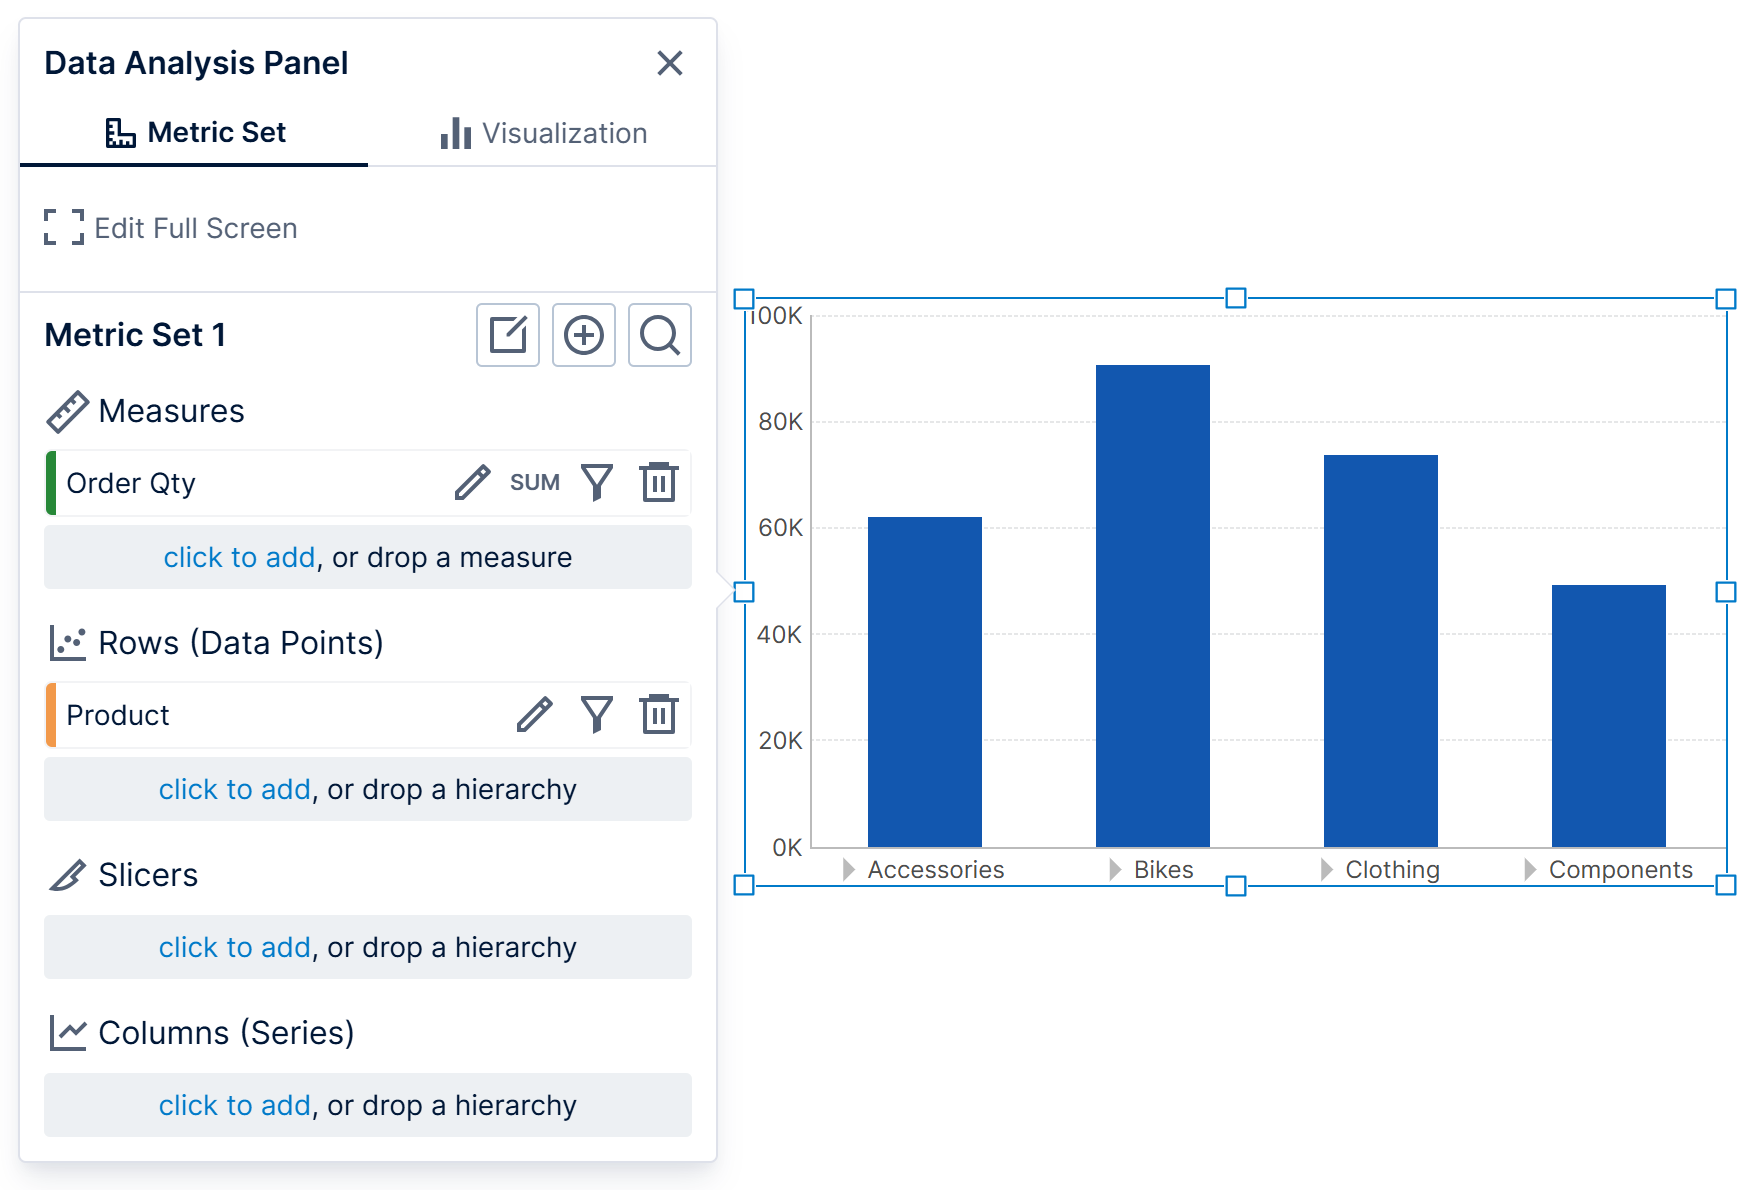
On our first dashboard, we are showing Order Qty by Product in this example.
3. Second dashboard
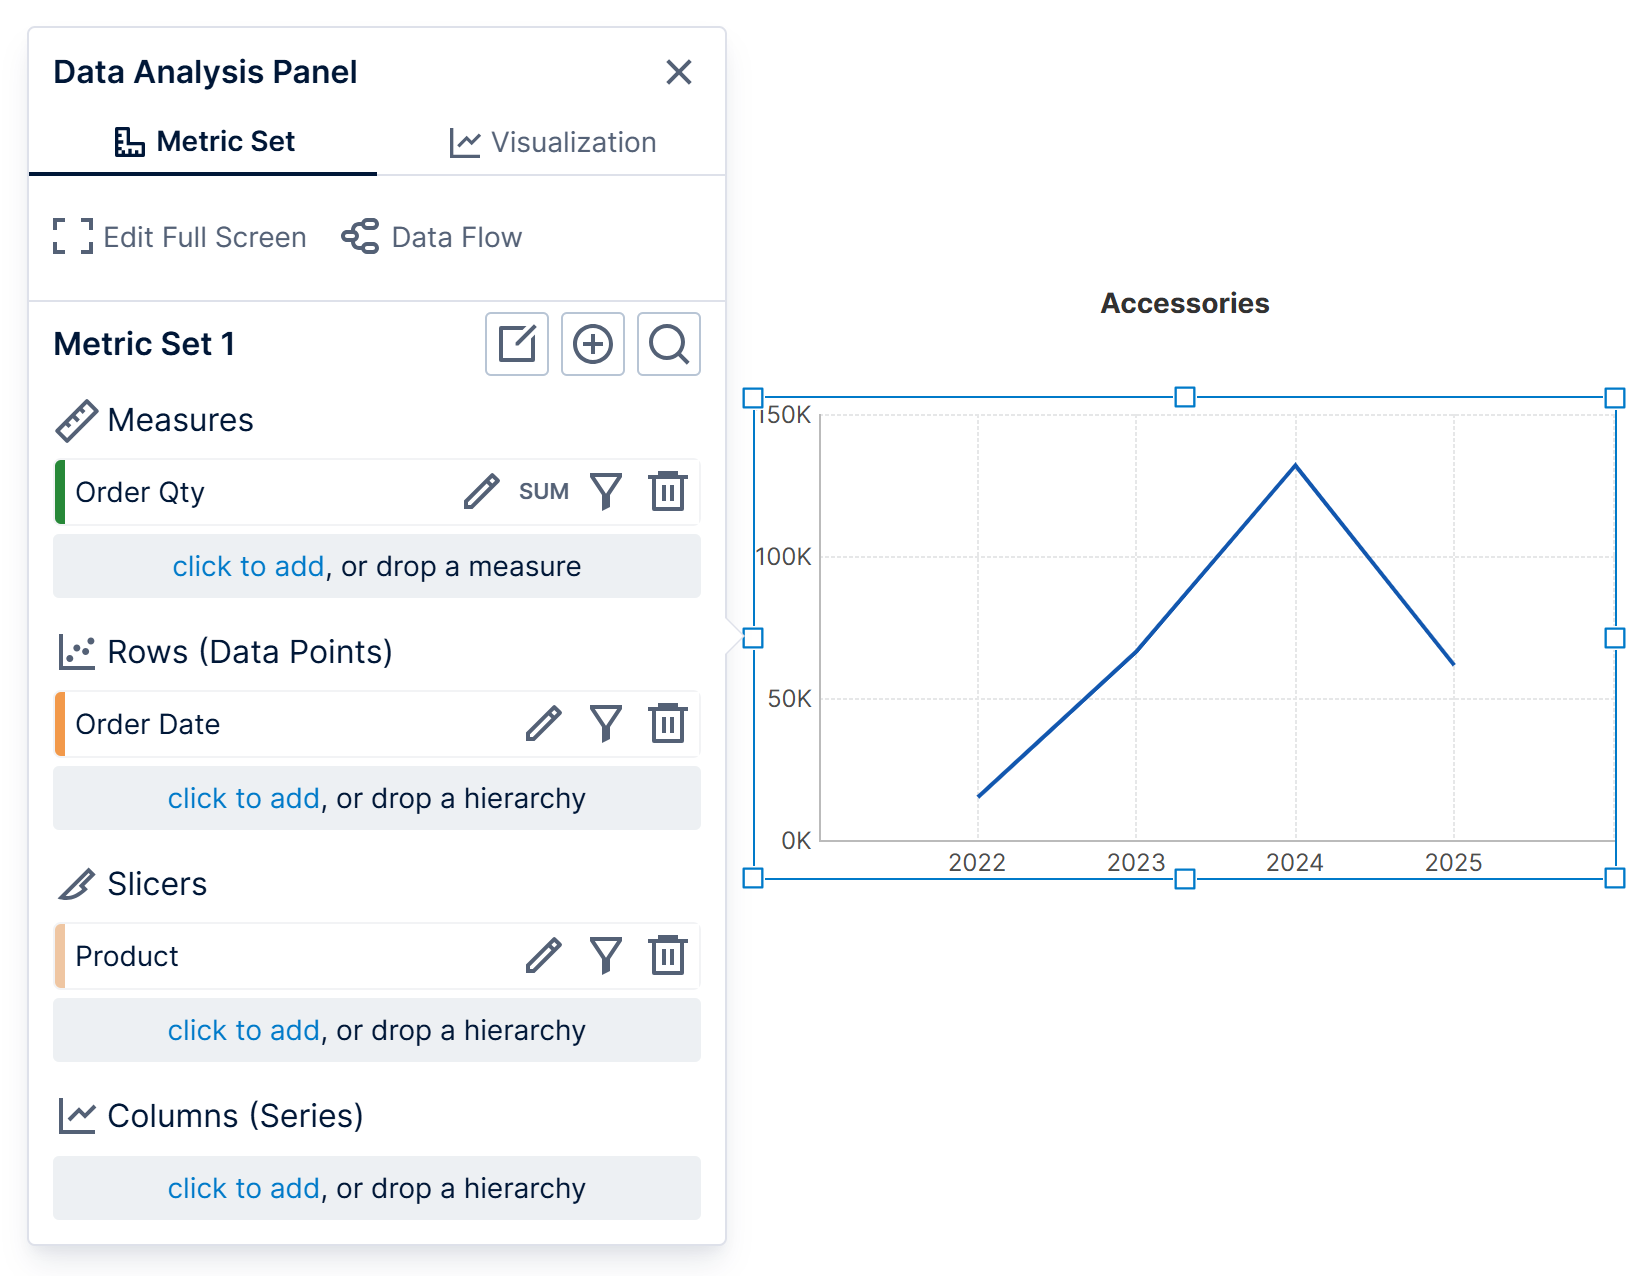
On our second dashboard, which we want to show in a pop-up, we are showing Order Qty by Date in this example.
To be able to display details specific to a data point that was hovered over in the first dashboard, we also:
- Added Product under Slicers in the Data Analysis Panel for the chart, so that we can filter by the product hovered over in the first dashboard.
- Added a data label to the dashboard, and dragged the same Product hierarchy onto it, so we can display the product hovered over in the first dashboard.
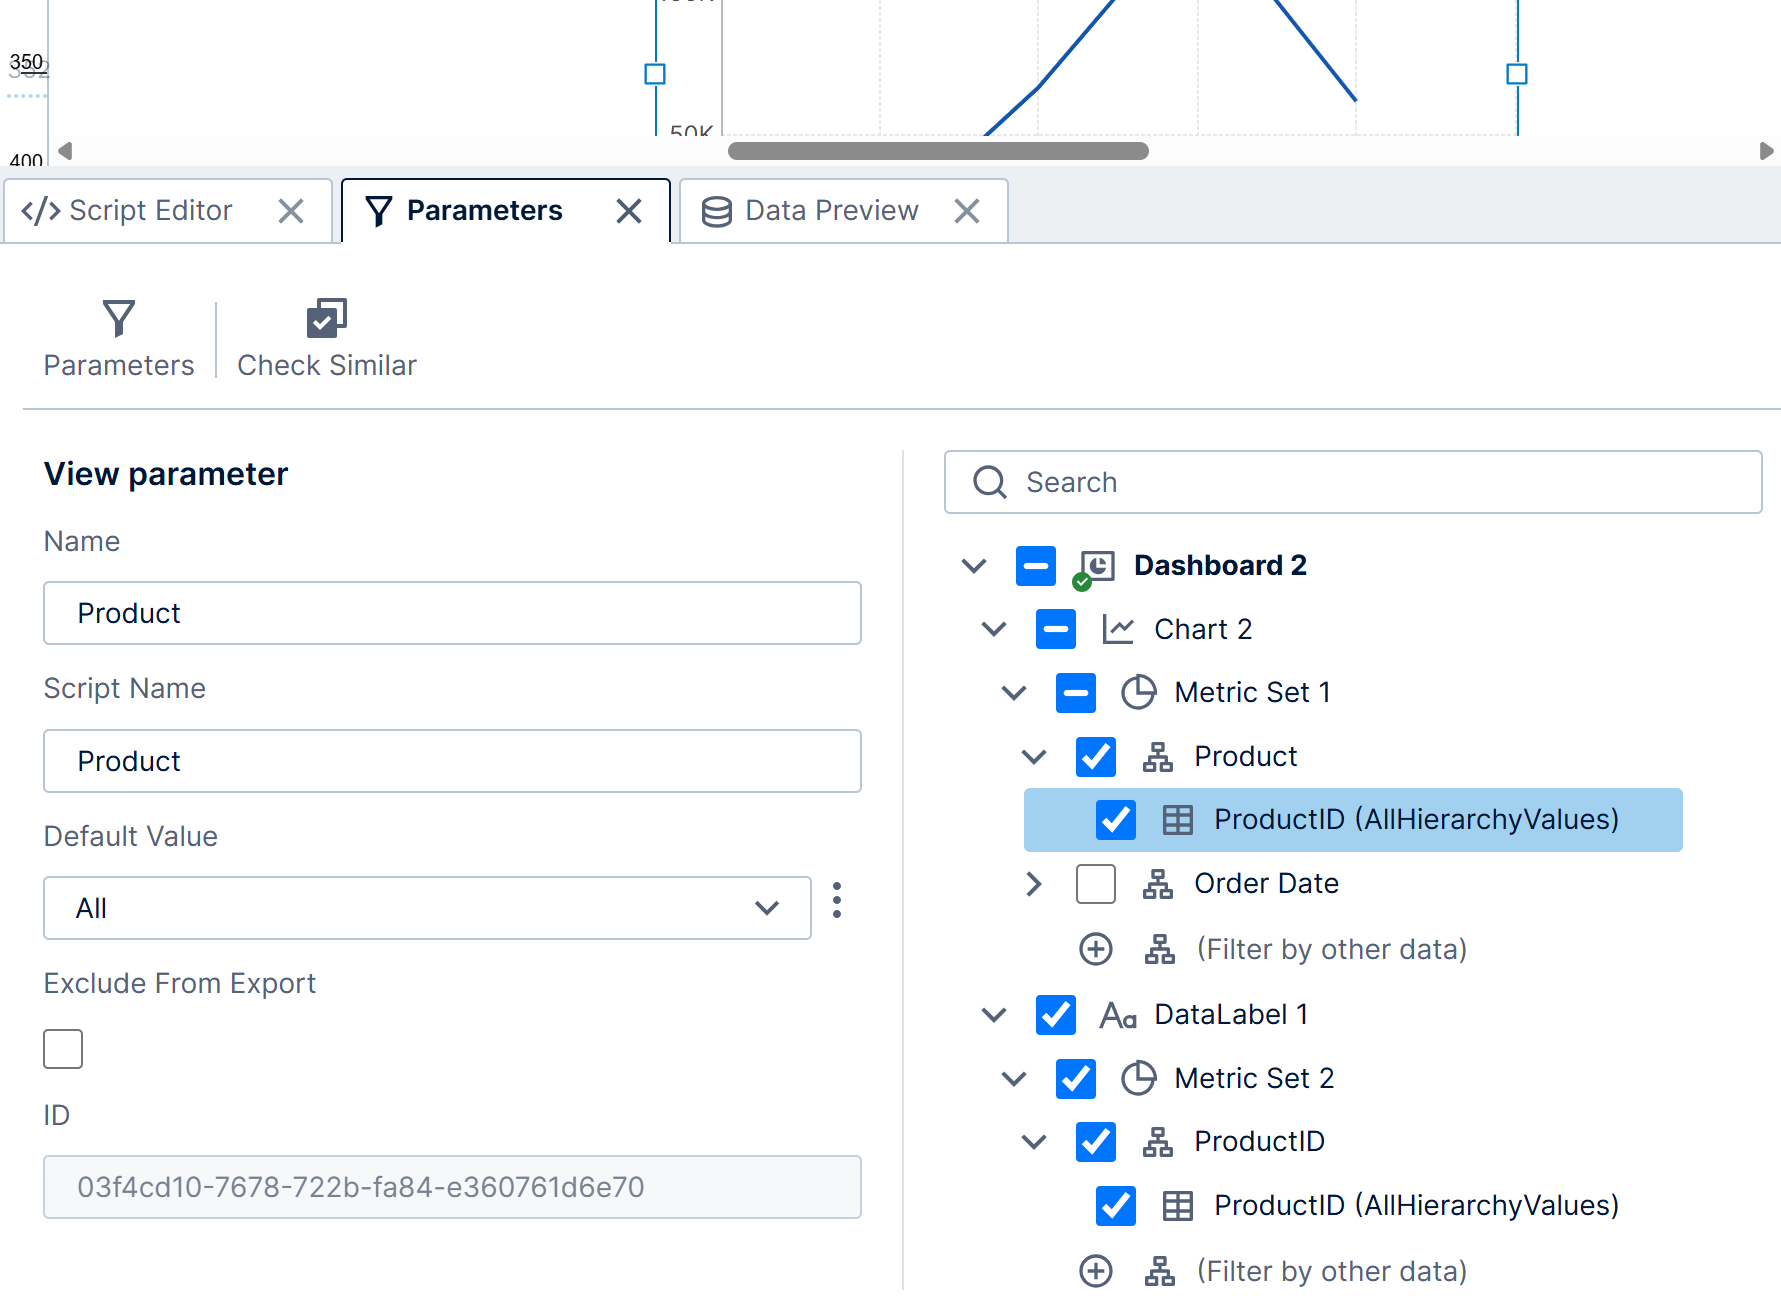
Next, expand the Parameters window, which is typically docked along the bottom of the screen.
Click Add New to add a new view parameter, and then connect it to the data to be filtered. In our example, this is the Product hierarchy for both the chart and the data label.
Pop-ups are typically small, so you may want to resize the dashboard smaller closer to the size of your intended pop-up.
4. Set up the hover over interaction
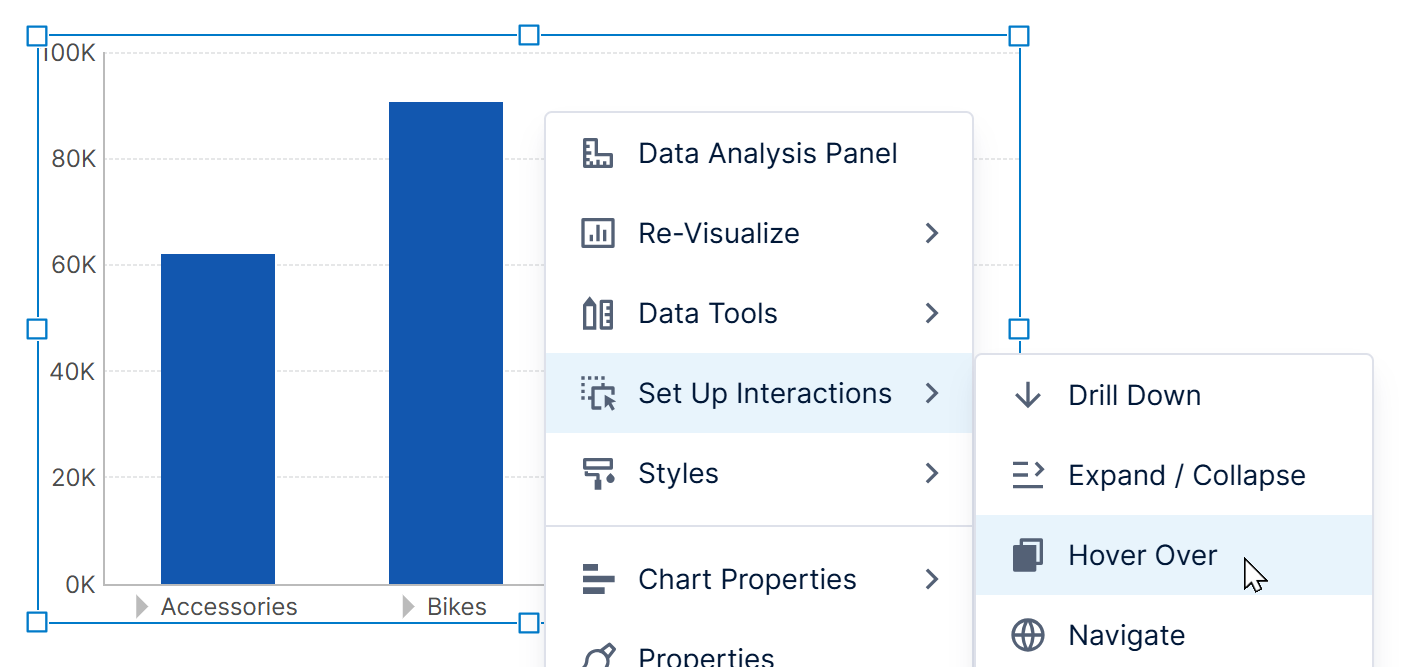
While editing the first dashboard with the chart selected, click Set Up Interactions and then Hover Over from the toolbar or right-click menu.
In the Set up a pop-up dialog, select the view to be displayed on hover-over (e.g., Dashboard 2).
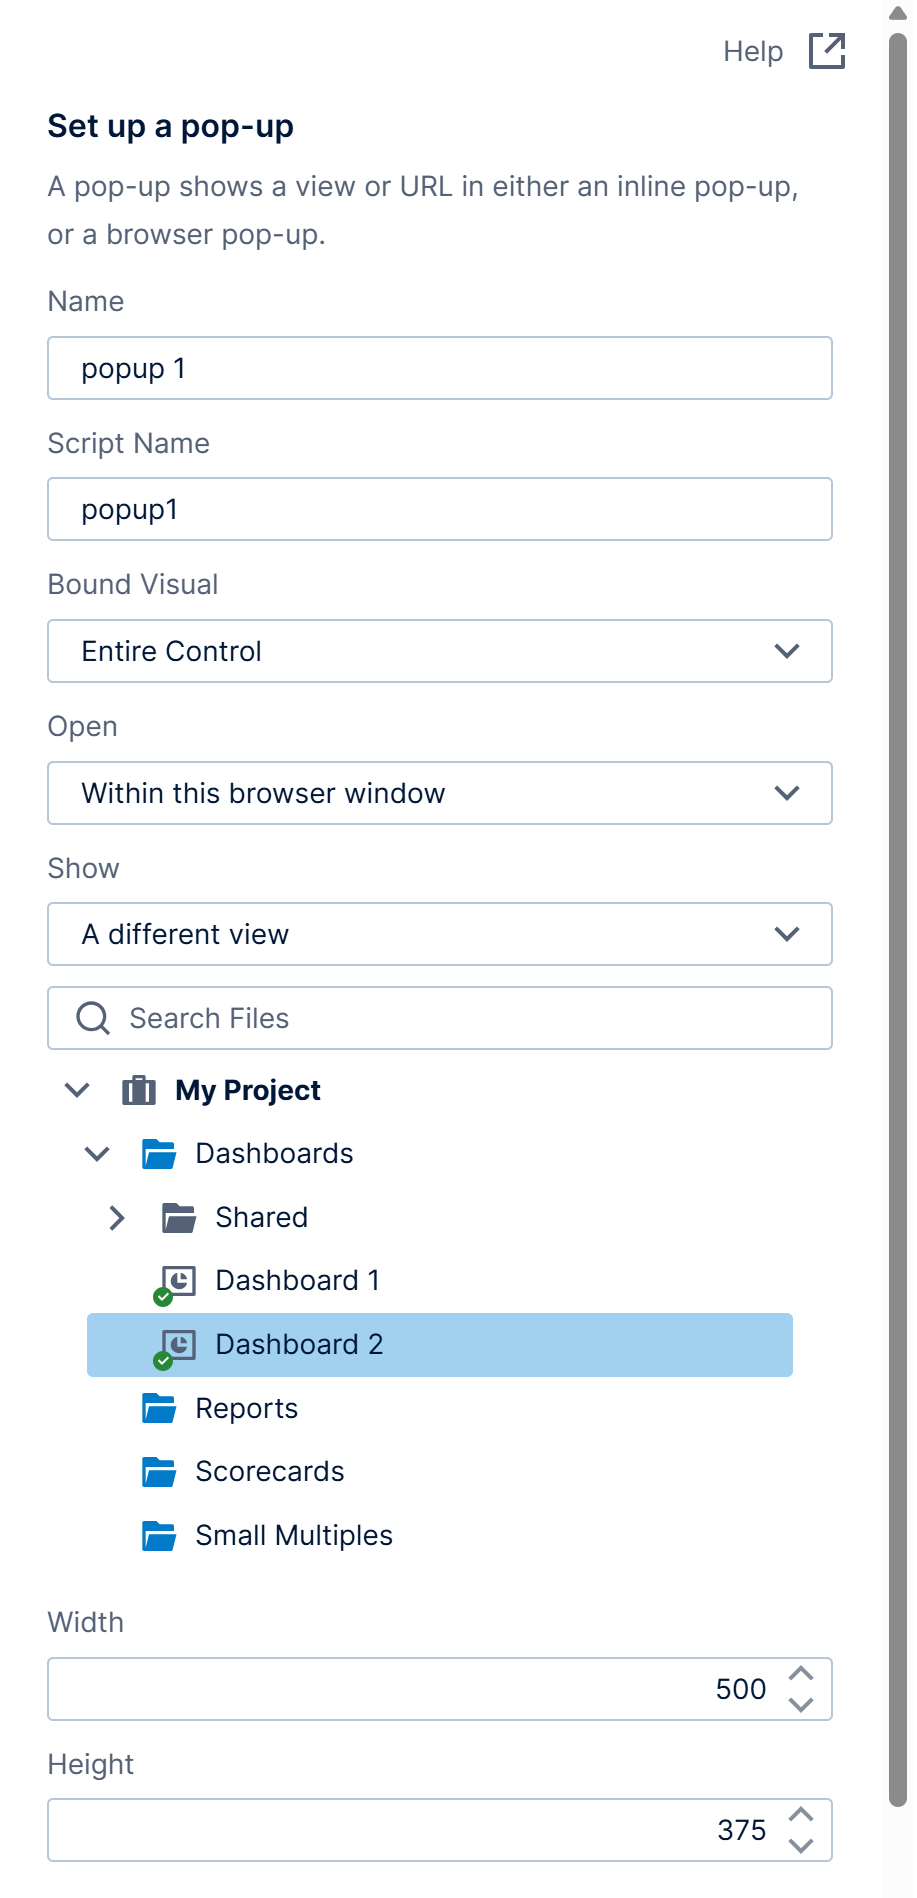
Adjust the pop-up's Width and Height as needed based on the size of your pop-up dashboard or how big you want the pop-up.
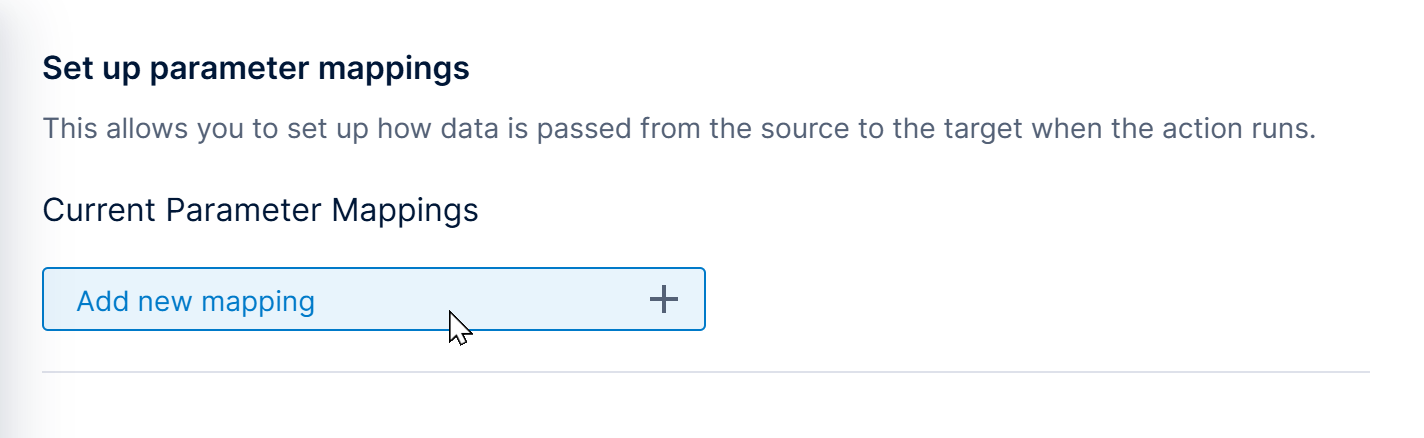
If you are passing a value from the data that was clicked, click Set up parameters at the bottom of the dialog, then Add new mapping.
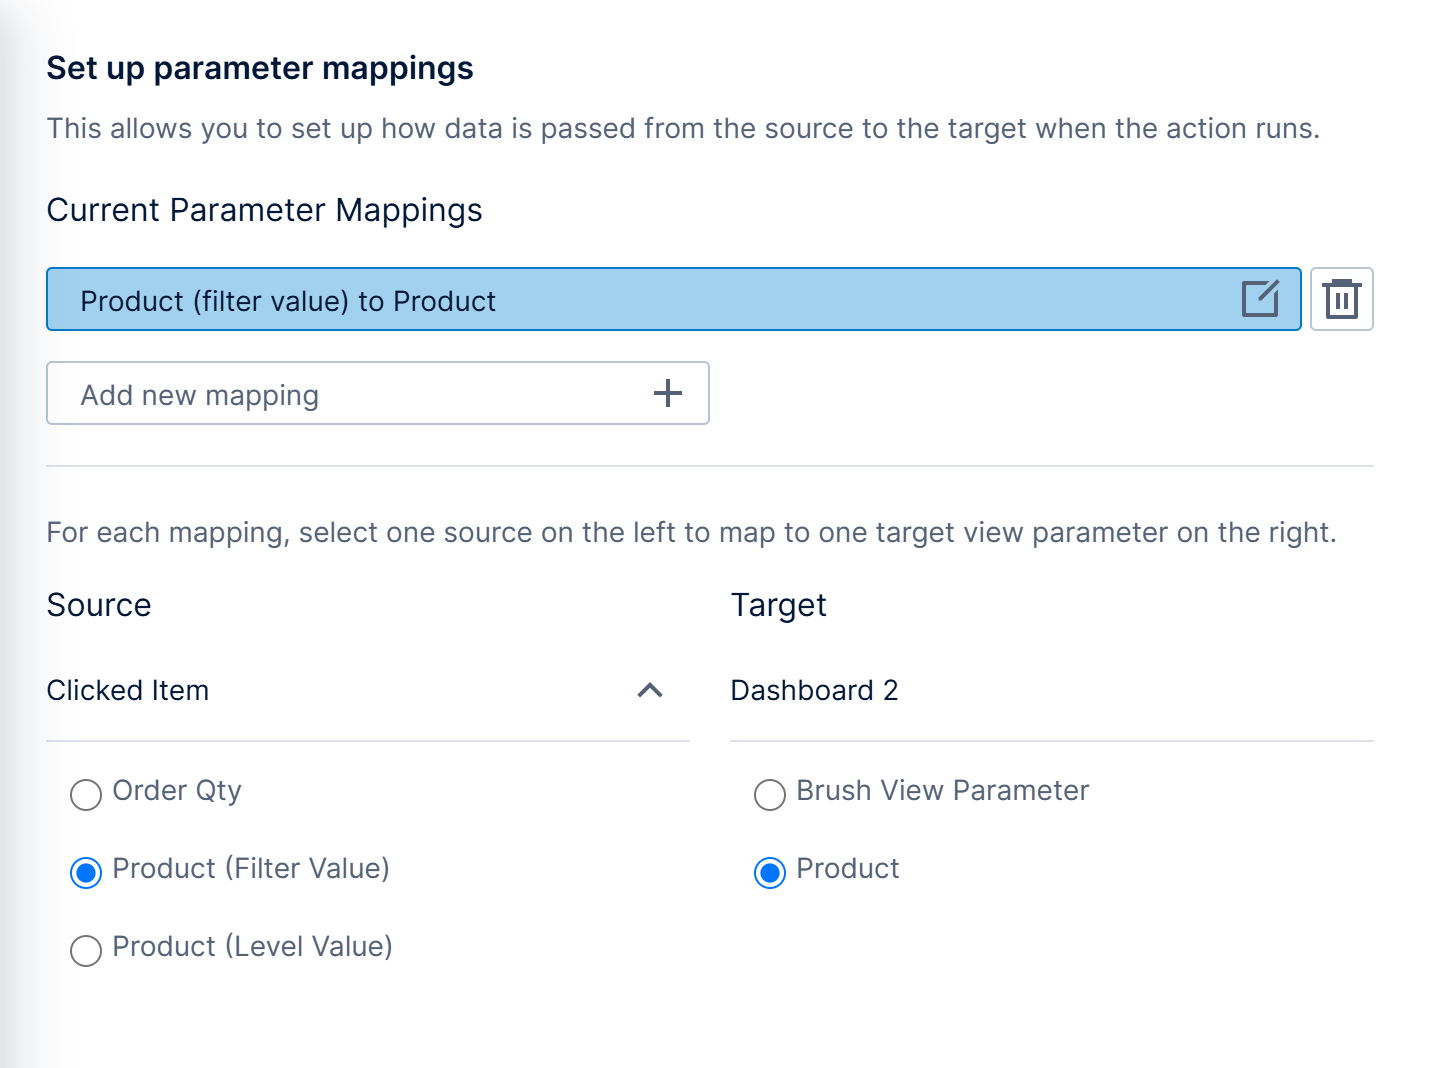
- Under Source, select the value you want to pass. This is Product (Filter Value) in our example.
- Under Target, select a view parameter in the target dashboard that corresponds with the passed value. In our example, we typed in the name Product for our view parameter in the second dashboard that we connected to product data.
5. Test the interaction
Switch to View mode in the toolbar and hover over a data point in the first dashboard.
You should see the second dashboard displayed in a pop-up that shows the data filtered by the hovered data point.