
Embedding
1. Overview
There are a number of ways you can embed Dundas BI or managed dashboards and reports from Logi Symphony. This article shows how you can embed views like dashboards and reports, individual visualizations, or a simplified, self-service dashboard creation experience, directly in your own web application without using iframes or cookies. These are powered by the JavaScript API, which you can also access with this embedding method.
Alternatively, you can embed the entire application or any page from it using other embedding methods. You can also take advantage of white labeling, API, and extension support.
2. Set up iframeless embedding
The first step to embedding directly onto your page is to add dundas.embedded.min.js. This file is included in your installation at the following location on disk:
[Instance Root]\www\BIWebsite\wwwroot\Scripts\Embed\dundas.embedded.min.js
This can be accessed under the base URL used to access Dundas BI or managed dashboards and reports in Logi Symphony, as /Scripts/Embed/dundas.embedded.min.js. For example, if https://symphony.example.com/managed/ takes you directly to Dundas BI or to managed dashboards and reports, your page might add:
<script src="https://symphony.example.com/managed/Scripts/Embed/dundas.embedded.min.js" type="text/javascript"></script>
There is a single method to call, which sets up the JavaScript API on your page by adding and loading all CSS and JavaScript dependencies:
// Relative or absolute URL to Dundas BI or Managed Dashboards and Reports:
let promise = window.setupDundasEmbedded('https://symphony.example.com/managed/');
| Parameter | Type | Description |
|---|---|---|
| baseURL | String | The relative or absolute URL to access the root of the application from the current page. |
| doNotAutoCreateBootstrap | Boolean | (optional) By default, a new dundas.views.embedded.Bootstrap is created immediately. If the document is not yet ready, pass true for this parameter and call this bootstrap's constructor at a later point. |
| Returns: | Promise | A Promise object that resolves once the JavaScript API bootstrap is ready for use. Note that this is not a jQuery.Promise as third-party libraries are not yet loaded when this method is called. |
3. Using the JavaScript API
When the setupDundasEmbedded method's Promise resolves, you can access the JavaScript API via dundas.context the same way as on a page within the application, and access its services.
Most actions require authentication, so first use the LogOnService to log on using a one-time token obtained from the server like in the following example, or another available LogOnService method:
let logonToken = myApp.getLogonTokenFromServer();
let promise = window.setupDundasEmbedded('https://symphony.example.com/managed/');
promise.then(() => {
    dundas.context.getService("LogOnService").logOnByToken(logonToken).done((result) => {
        if (result.sessionId) {
            // Logon successful!
        }
    });
});
The result of a logon method has the properties defined by LogOnResultData (beginning in lowercase in JavaScript). If a session ID is not populated in the result, the logon was likely not successful and the other properties will contain details about the reason.
After a successful logon, set the session ID so that you can embed content or access other services. You can call setSessionId on dundas.context, or pass the session ID into one of the embedding methods described below as a shortcut.
4. Embedding content
When embedded directly onto your page, dundas.context is a dundas.views.embedded.Bootstrap.
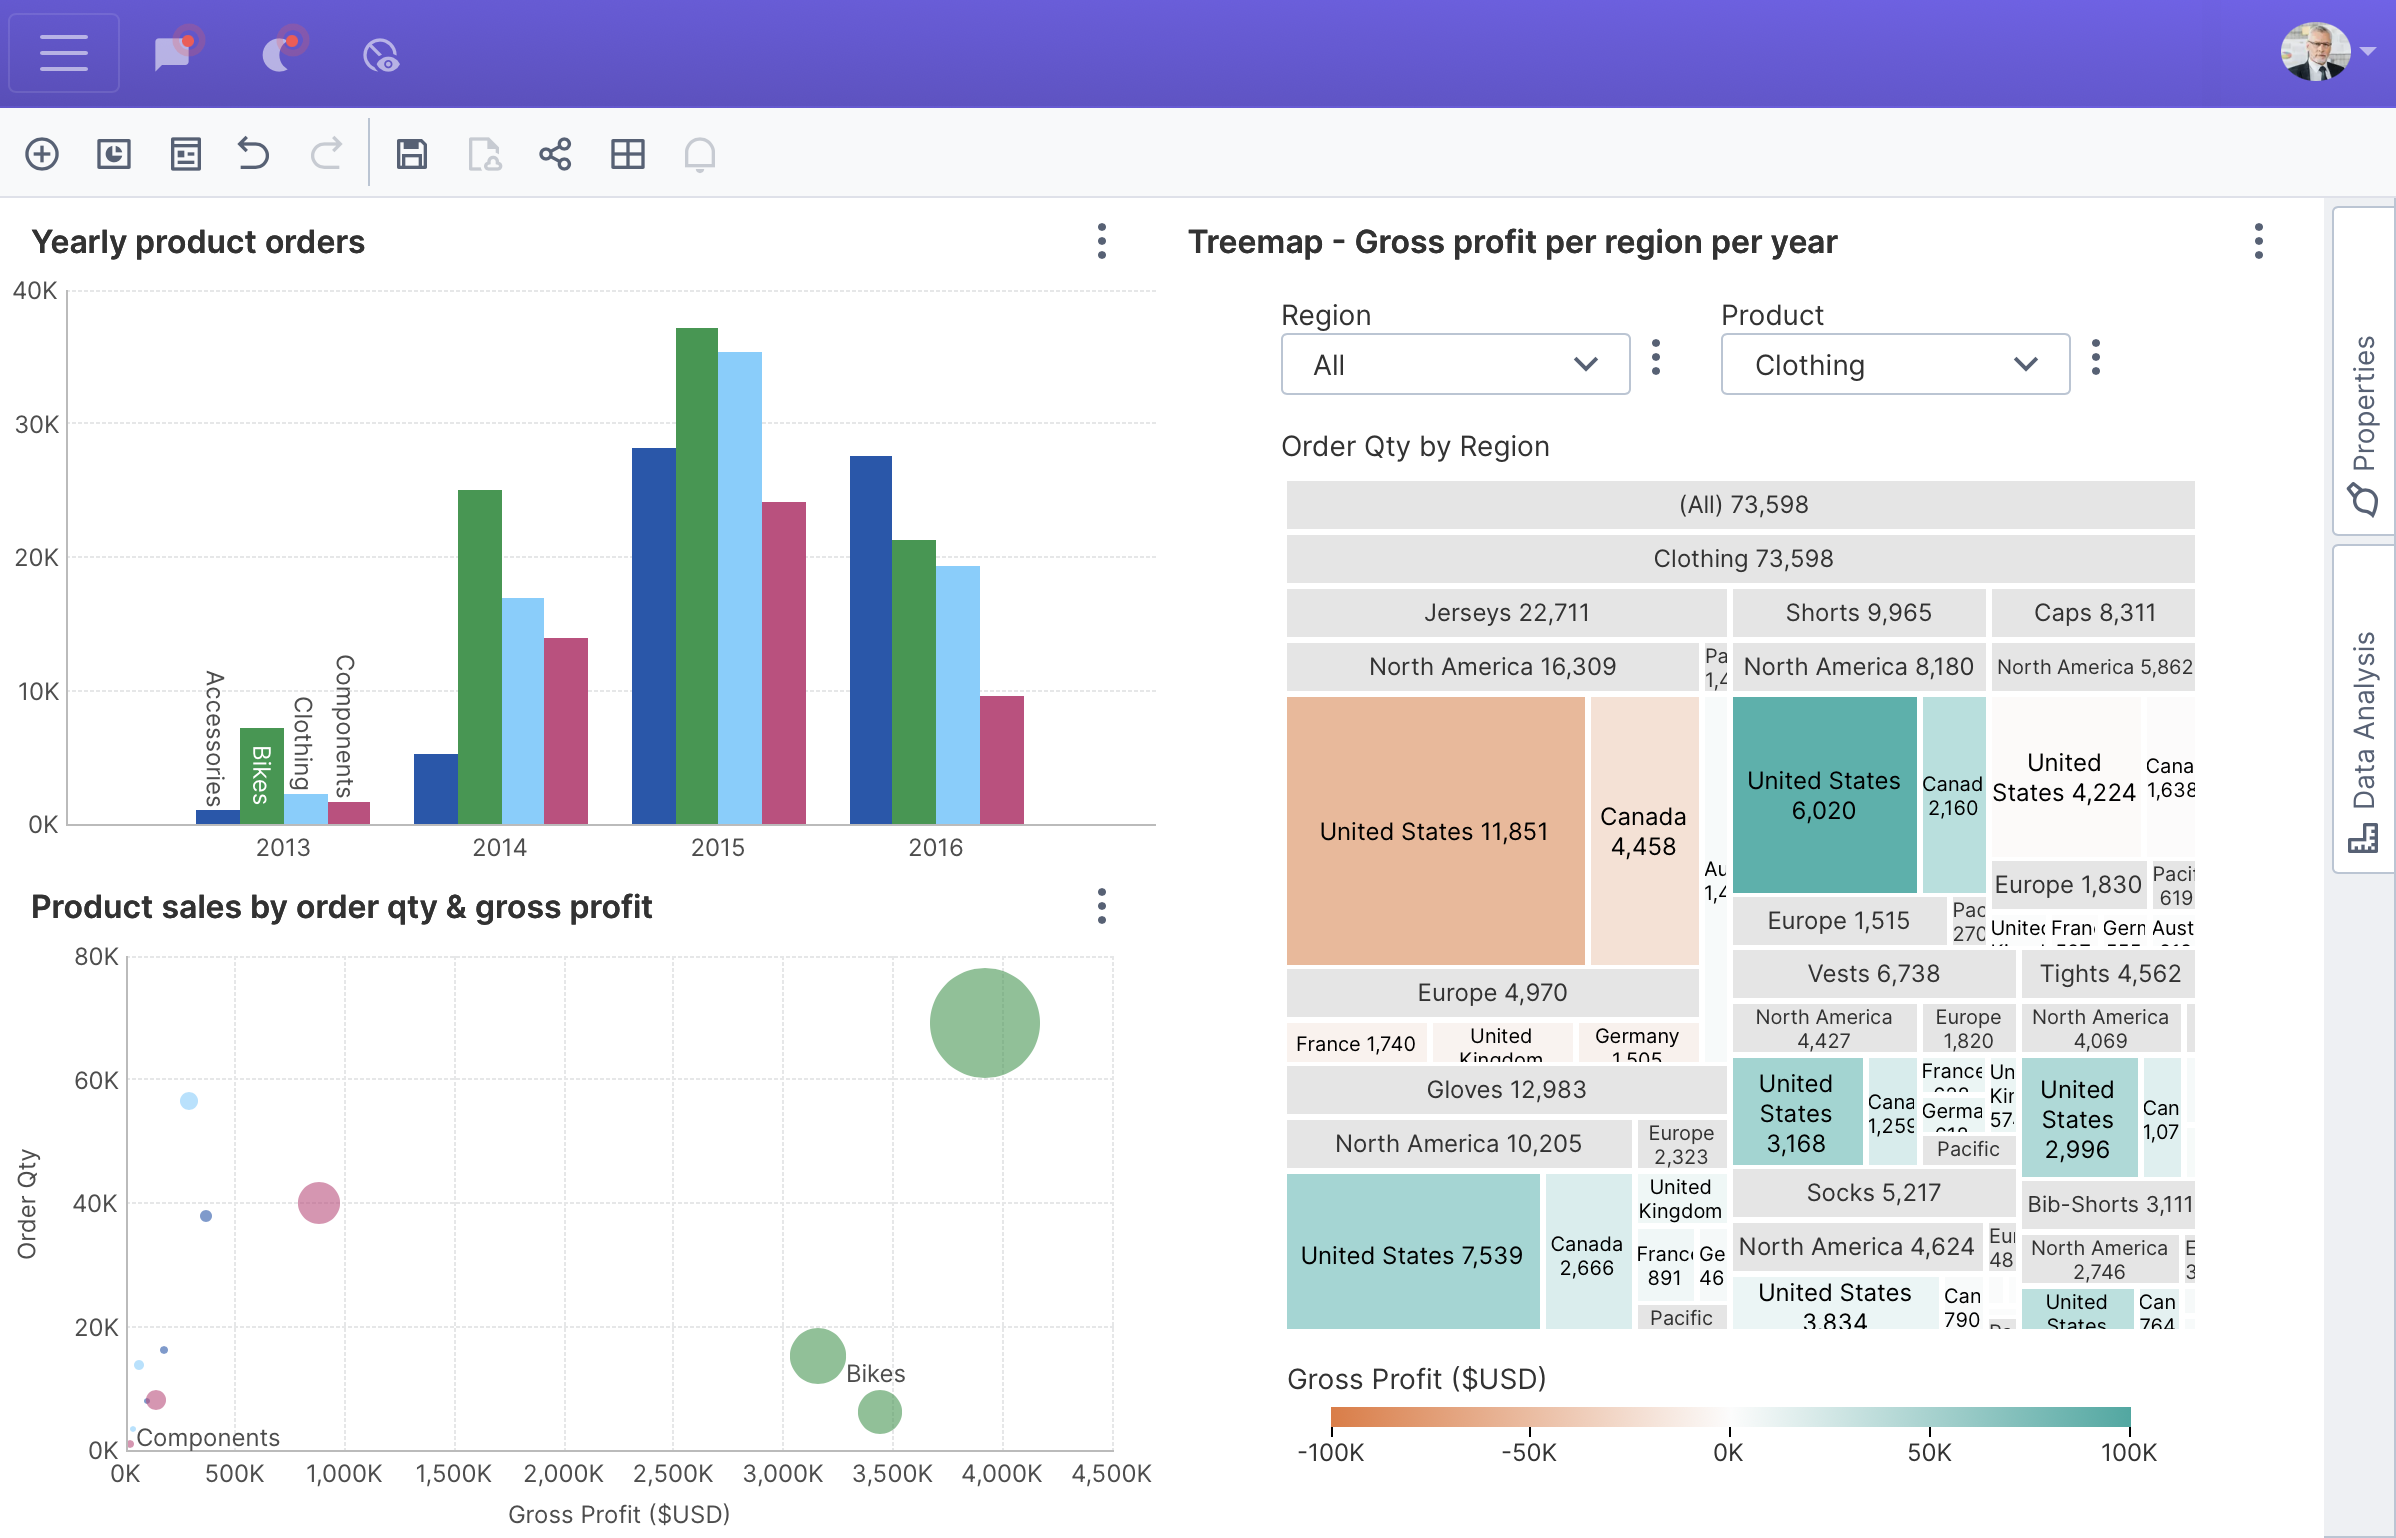
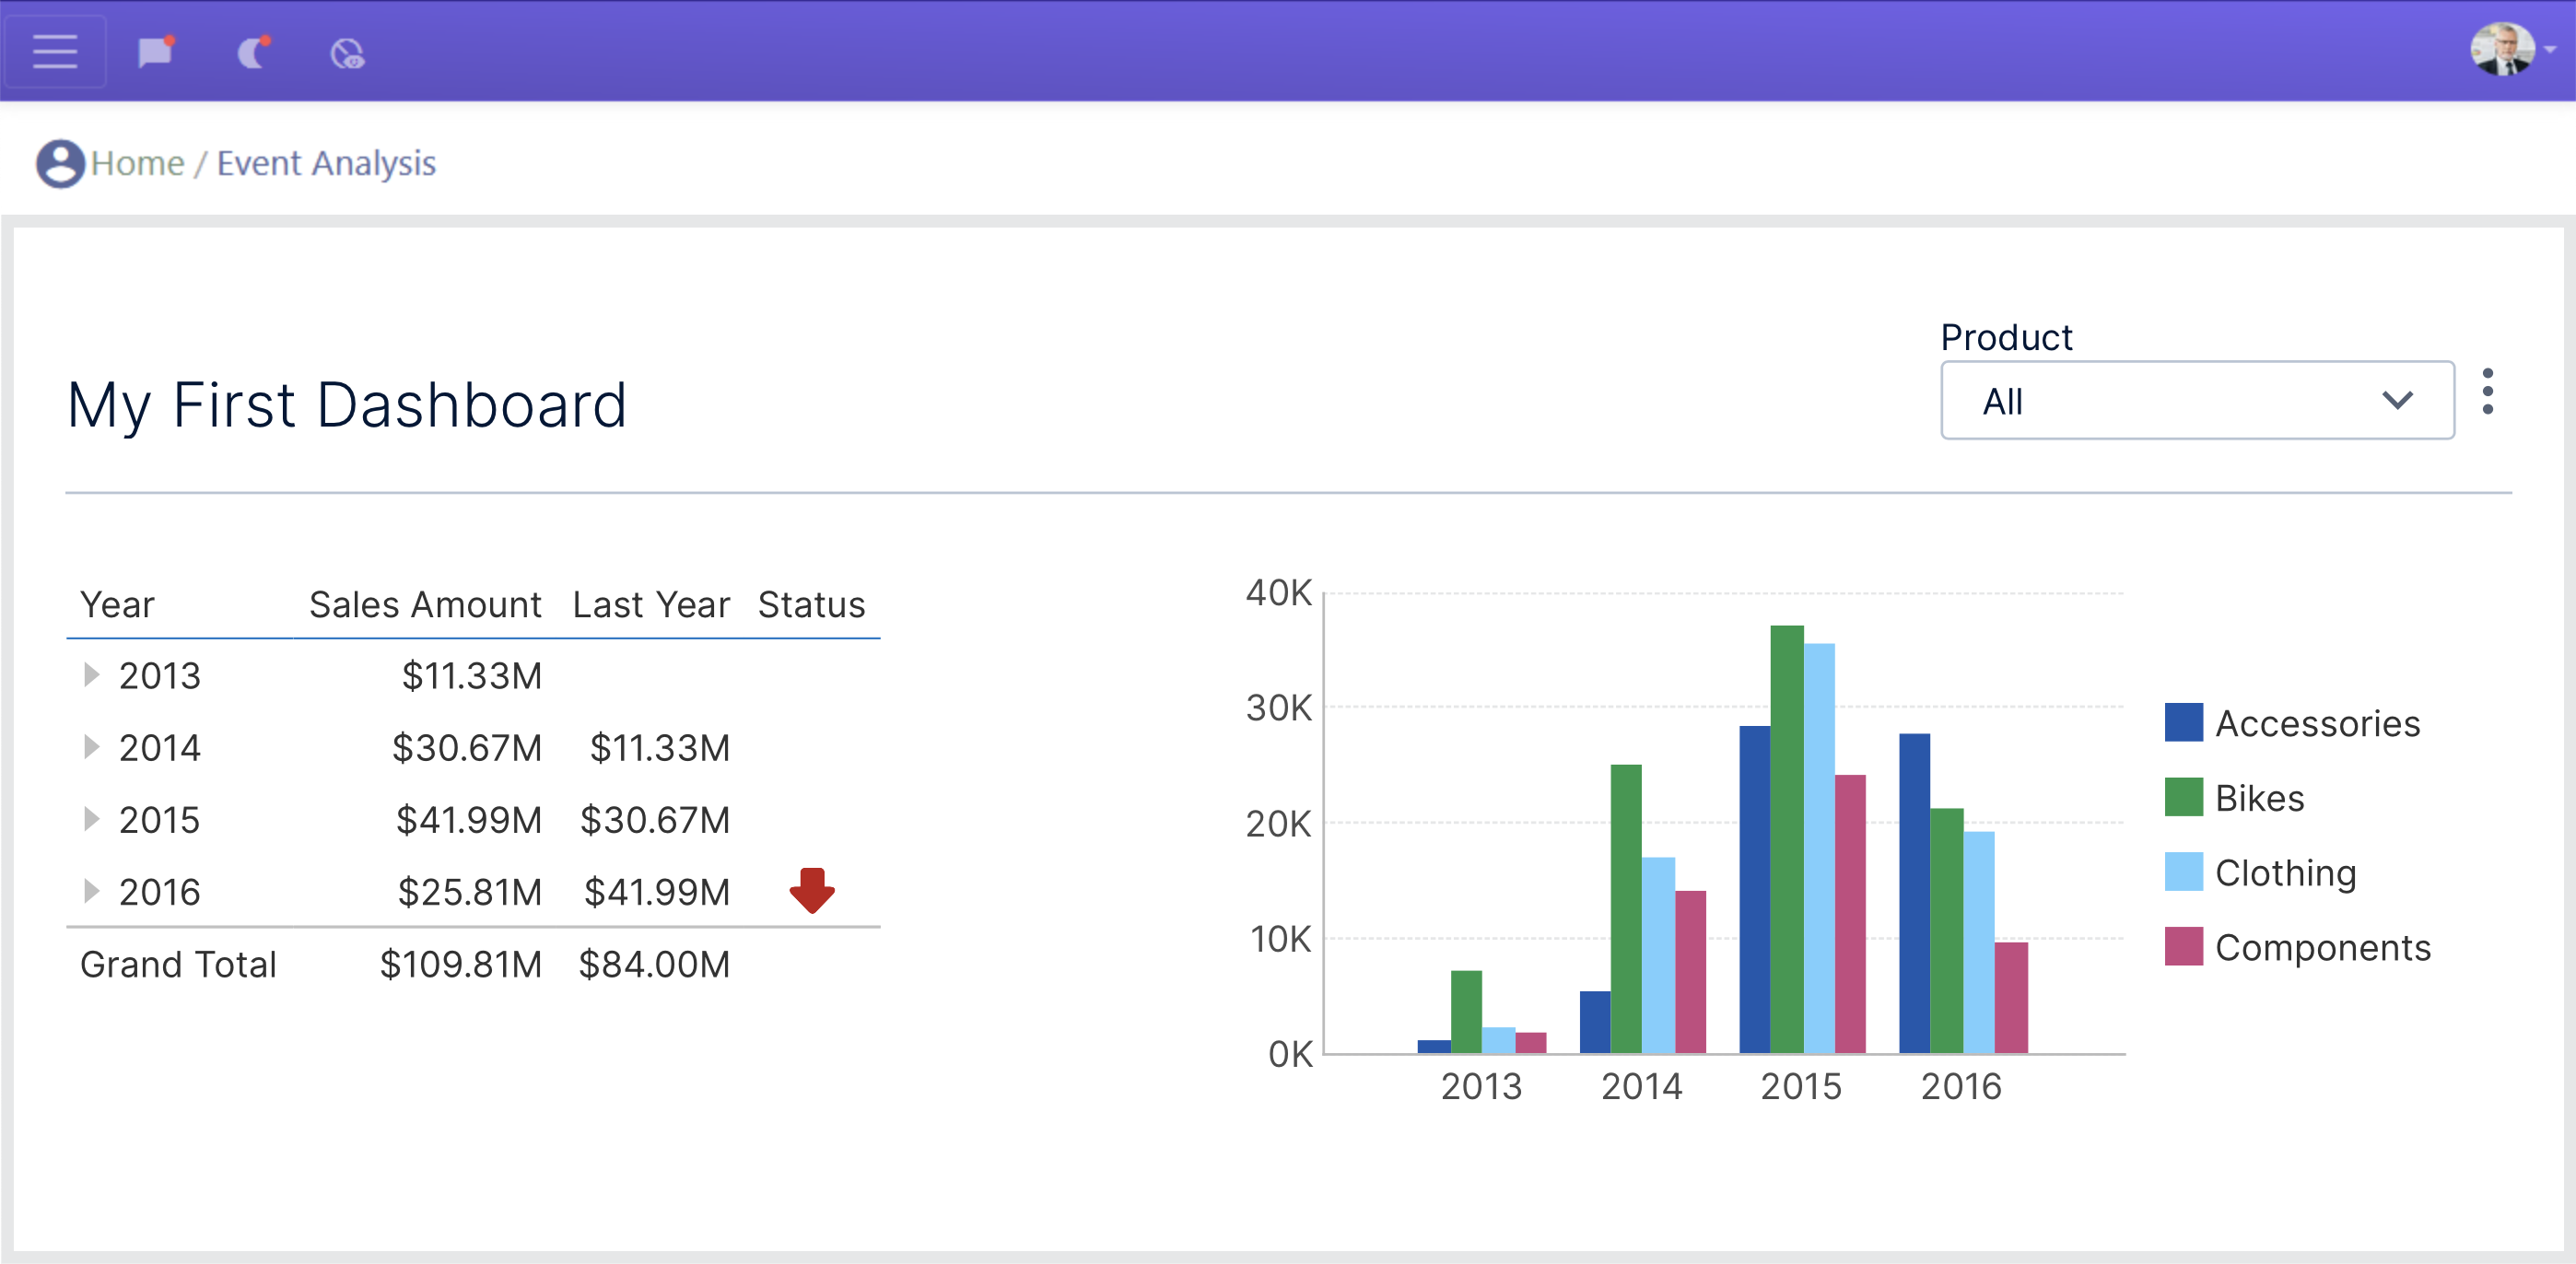
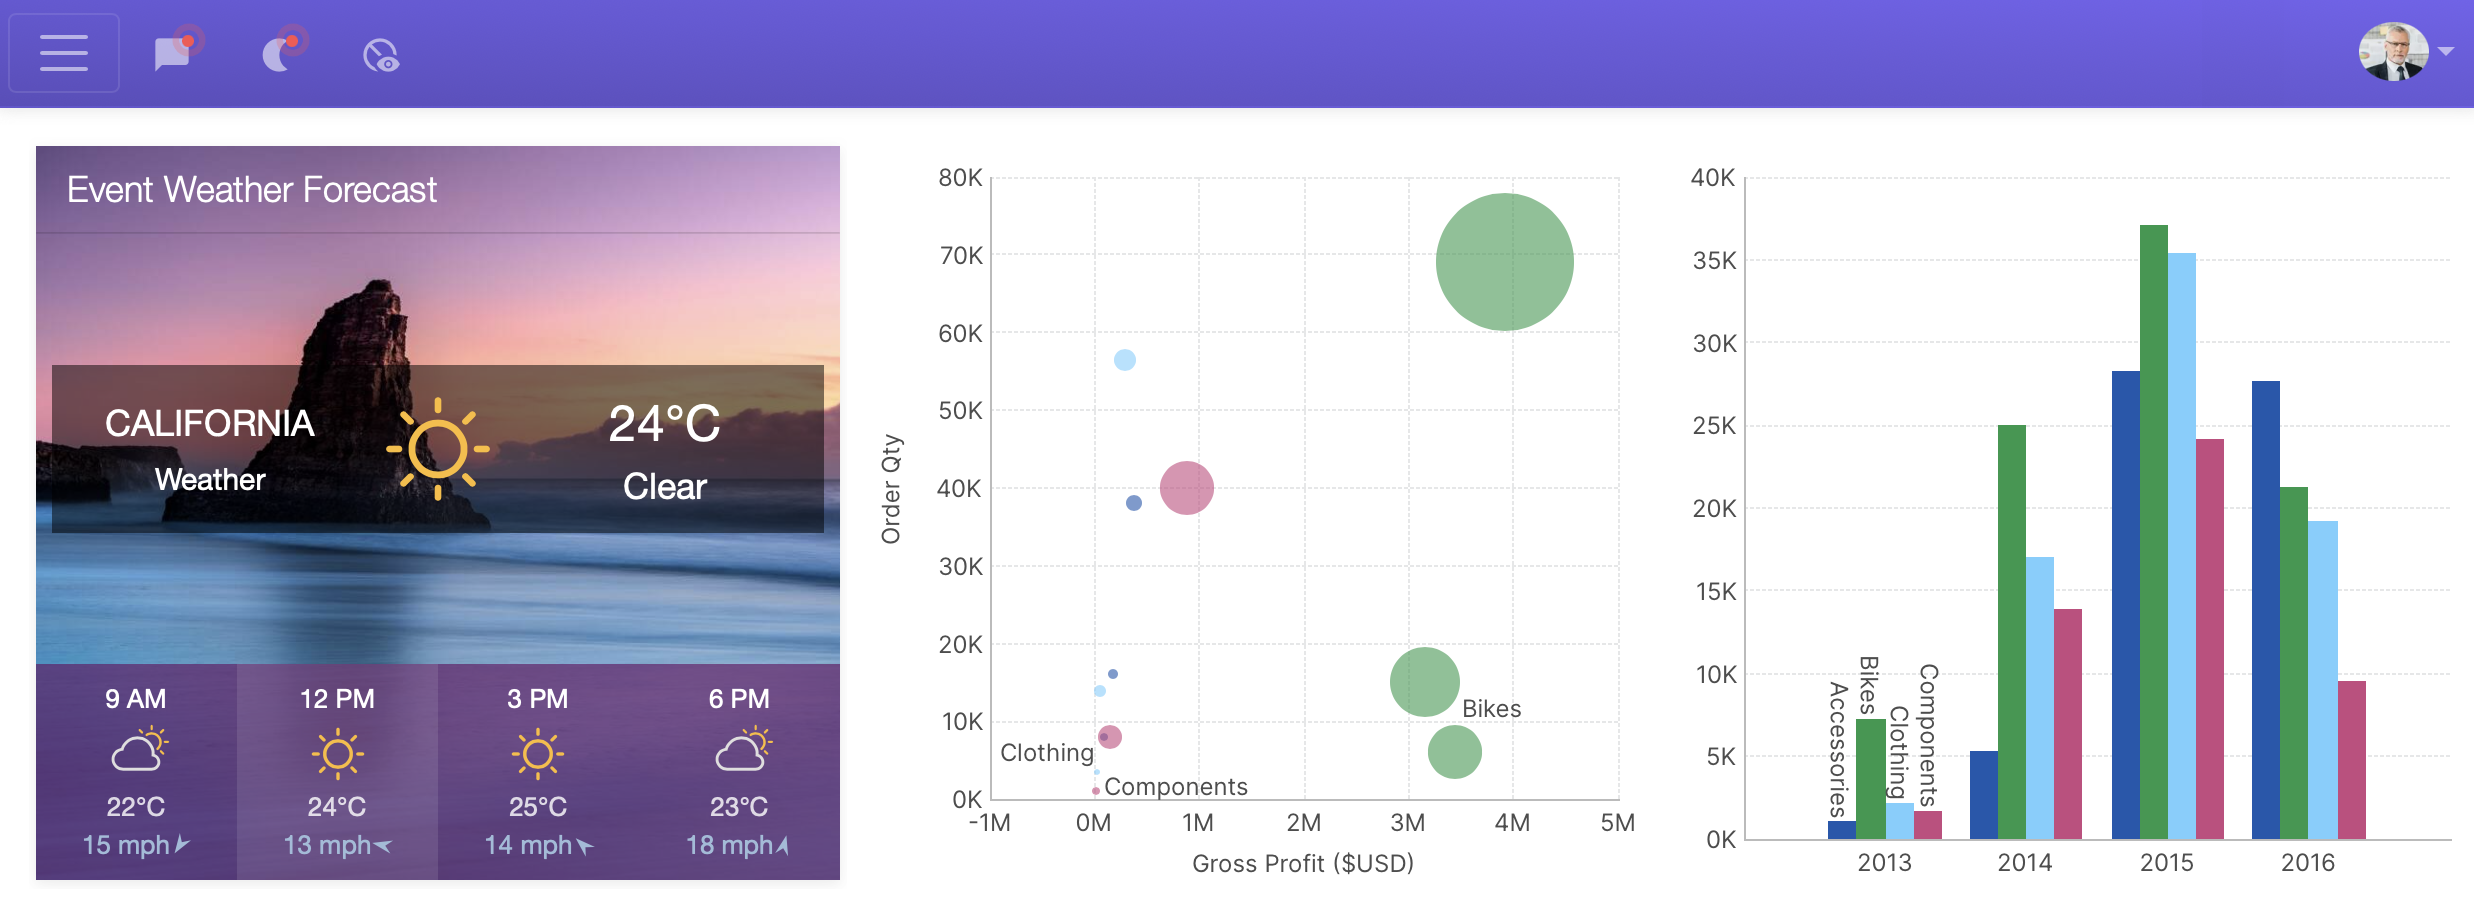
Call its embedView method to embed an existing dashboard, report, or other view type by its ID, which you can find from its URL or properties dialog. It is rendered inside the DOM element you specify, which should have some set size independent of its contents (i.e., not auto). The following embeds a dashboard:
let element = document.getElementById("viewContainer");
dundas.context.embedView(element, "bdba4203-8d2f-4c90-9449-cfbe81e38964", {
    sessionId: sessionId
});
The third argument is an object specifying additional optional values. Important options include passing sessionId as an alternative to first calling and waiting for setSessionId, and viewType when embedding a type of view other than a dashboard like in the next example. A jQuery.Promise is returned that you can use to wait for the embedding to complete.
Content is always embedded on its own without other interface elements like the application's toolbar or main menu, but with most functionality accessible by default as usual from the context menu via right-click or long-tap.
If you are embedding multiple items on your page, a separate EmbeddedViewService is used for displaying each one. Specify an embeddedViewServiceName of your choice starting at least with the second embedding call (omitting this will cause an error such as "Service EmbeddedViewService is already registered"). Be sure either to wait for the first embedding method to finish, or to call and wait for setSessionId first before embedding any content as follows:
let element1 = document.getElementById("container1");
let element2 = document.getElementById("container2");
dundas.context.setSessionId(result.sessionId).done(() => {
    dundas.context.embedView(element1, "8166d221-af1a-1881-40c6-f09ed09fe735");
    dundas.context.embedView(element2, "06294698-2d5a-9b4a-7b46-195db1d30397", {
        embeddedViewServiceName: "EmbeddedReportService",
        viewType: dundas.entities.ViewType.REPORT
    });
});
4.1. Parameter values
When calling embedView, the viewOverrides option can be used to pass in as well as create view parameter values. The same parameter value types are used as in the article Modify a filter / view parameter using scripting.
The following example sets an existing numeric parameter with the script name viewParameter1 when embedding the dashboard:
var numberValue = new dundas.data.RangeNumberValue({
    lowerBoundaryValue: 1200,
    upperBoundaryValue: 1800
});
var overrides = new dundas.view.controls.ViewOverrides();
overrides.defaultViewParameterValues.push({
    viewParameterName: "viewParameter1",
    parameterValue: numberValue
});

dundas.context.embedView(document.getElementById("viewContainer"), "<insert ID>", {
    sessionId: sessionId,
    viewOverrides: overrides
});
Similarly, you can create a view parameter that did not already exist, like the following that sets some specific hierarchy members by their unique names:
var newViewParameter = new dundas.view.ViewParameter();
newViewParameter.addElementParameterLink(new dundas.view.ElementParameterLink({
    adapterId: "9ae85f75-0213-f2b6-98e8-e200fd42b2cf",
    elementUsageUniqueName: "Customer Count",
    metricSetBindingId: "ba37ecdc-a049-9fca-66b1-1ef9f911147f",
    parameterId: "58e027c3-883d-4cc8-a5b9-1cf83a36deaf"
}));
newViewParameter.parameterValue = new dundas.data.CollectionMemberValue({
    values: [
        new dundas.data.MemberValue({
            "hierarchyUniqueName": "Product",
            "uniqueName": "Accessories.C.Product",
            "levelUniqueName": "C.Product",
        }),
        new dundas.data.MemberValue({
            "hierarchyUniqueName": "Product",
            "uniqueName": "Clothing.C.Product",
            "levelUniqueName": "C.Product",
        })
    ]
});

var overrides = new dundas.view.controls.ViewOverrides();
overrides.viewParameters.push(newViewParameter);

dundas.context.embedView(document.getElementById("viewContainer"), "<insert ID>", {
    embeddedViewServiceName: "DashboardEmbeddedViewService",
    viewOverrides: overrides
});
4.2. Applying themes
As an example of using other services from the JavaScript API, the following script uses the ThemeService to get a theme by its file ID, then calls the method on the current view (e.g., dashboard or report) to apply it:
dundas.context.getService("ThemeService").getThemeById("89f89a14-09fd-435b-ae7b-78265f2cdb7e").done((theme) => {
    dundas.context.baseViewService.currentView.applyTheme(theme);
});
4.3. Embedding metric sets
Calling embedMetricSet is similar to calling embedView but for an existing metric set and its default visualization. The same additional arguments are needed when embedding multiple items on the same page.
The following embeds a single metric set:
let container = document.getElementById("visualizationContainer");
dundas.context.embedMetricSet(container, "7b8123df-36fd-4994-b6f6-2f6d96999fab", {
    sessionId: sessionId
});
5. Ad hoc dashboards
You can embed a simplified, self-serve dashboard creation experience directly onto your own application's page by calling the createAdhocDashboard method. This enables your application's users to create and customize their own ad hoc dashboards and visualizations using a subset of features of the full design experience to ensure all types of users can instantly take advantage of its capabilities.
See the method's arguments for options you can pass for various customizations, plus the same sessionId and embeddedViewServiceName options as described earlier. The following example passes the session ID as a shortcut to first calling setSessionId, and otherwise uses default options:
dundas.context.createAdhocDashboard(document.getElementById("container"), {
    sessionId: result.sessionId,
    defaultProjectId: "66001453-f386-4cc0-b9ae-dcd6fa5e53a1"
});
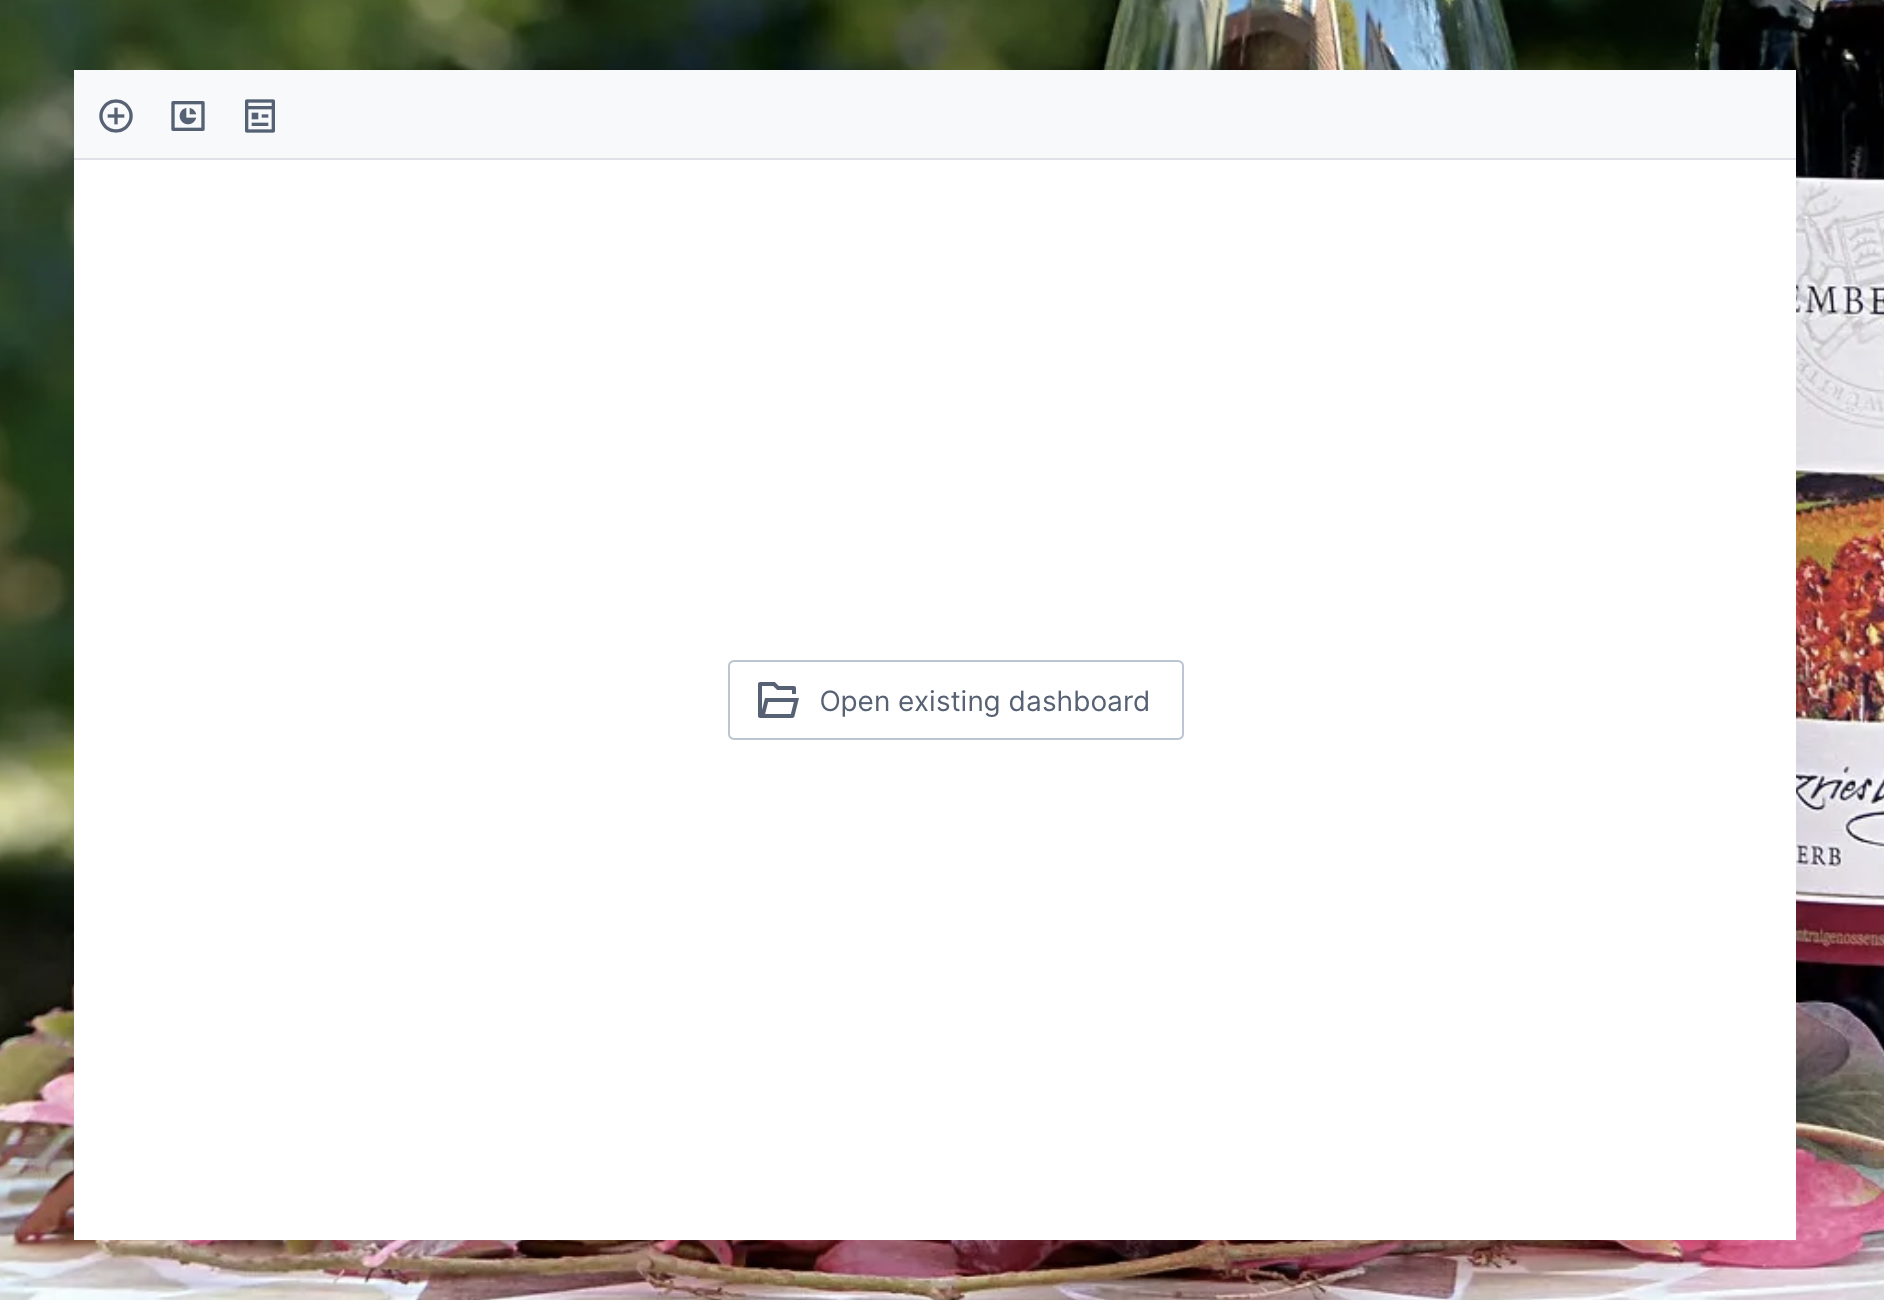
By default, the blank ad hoc dashboard editor opens and allows users to choose an existing ad hoc dashboard to open, or to click in the toolbar to add existing data or other content to create a new one. These are saved in and opened from the project specified by the defaultProjectId option, or the user's 'my project' if not specified.
5.1. Creating & editing
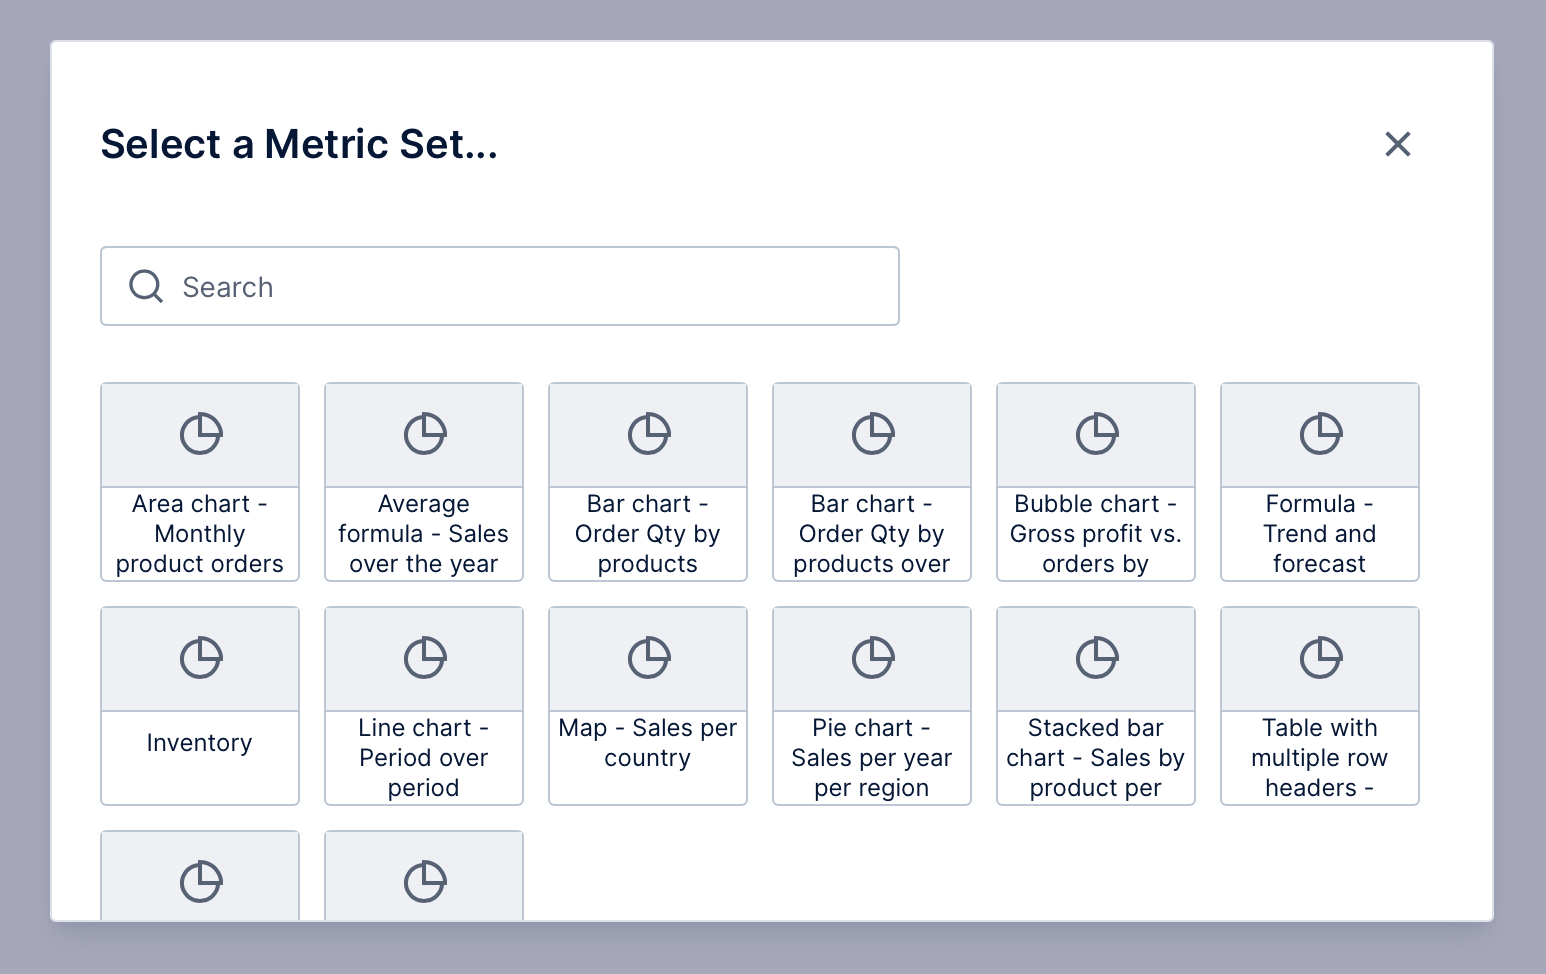
From the blank editor, clicking on a toolbar button adds content to a new ad hoc dashboard. Users can click the first button to add data via a metric set, choosing from a list of all metric sets made available to the logged-in user according to their set file security privileges.
Added content is always positioned automatically to fill all available space and dynamically resize itself, with a built-in title that users can click to change.
The menu icon in the top-right corner of each content item provides options such as Delete to remove it from the dashboard, or Re-Visualize for switching between visualization types while displaying the same data. Users can also right-click or long-tap directly on data to access the metric set's contextual options such as drill down, filtering, and more.
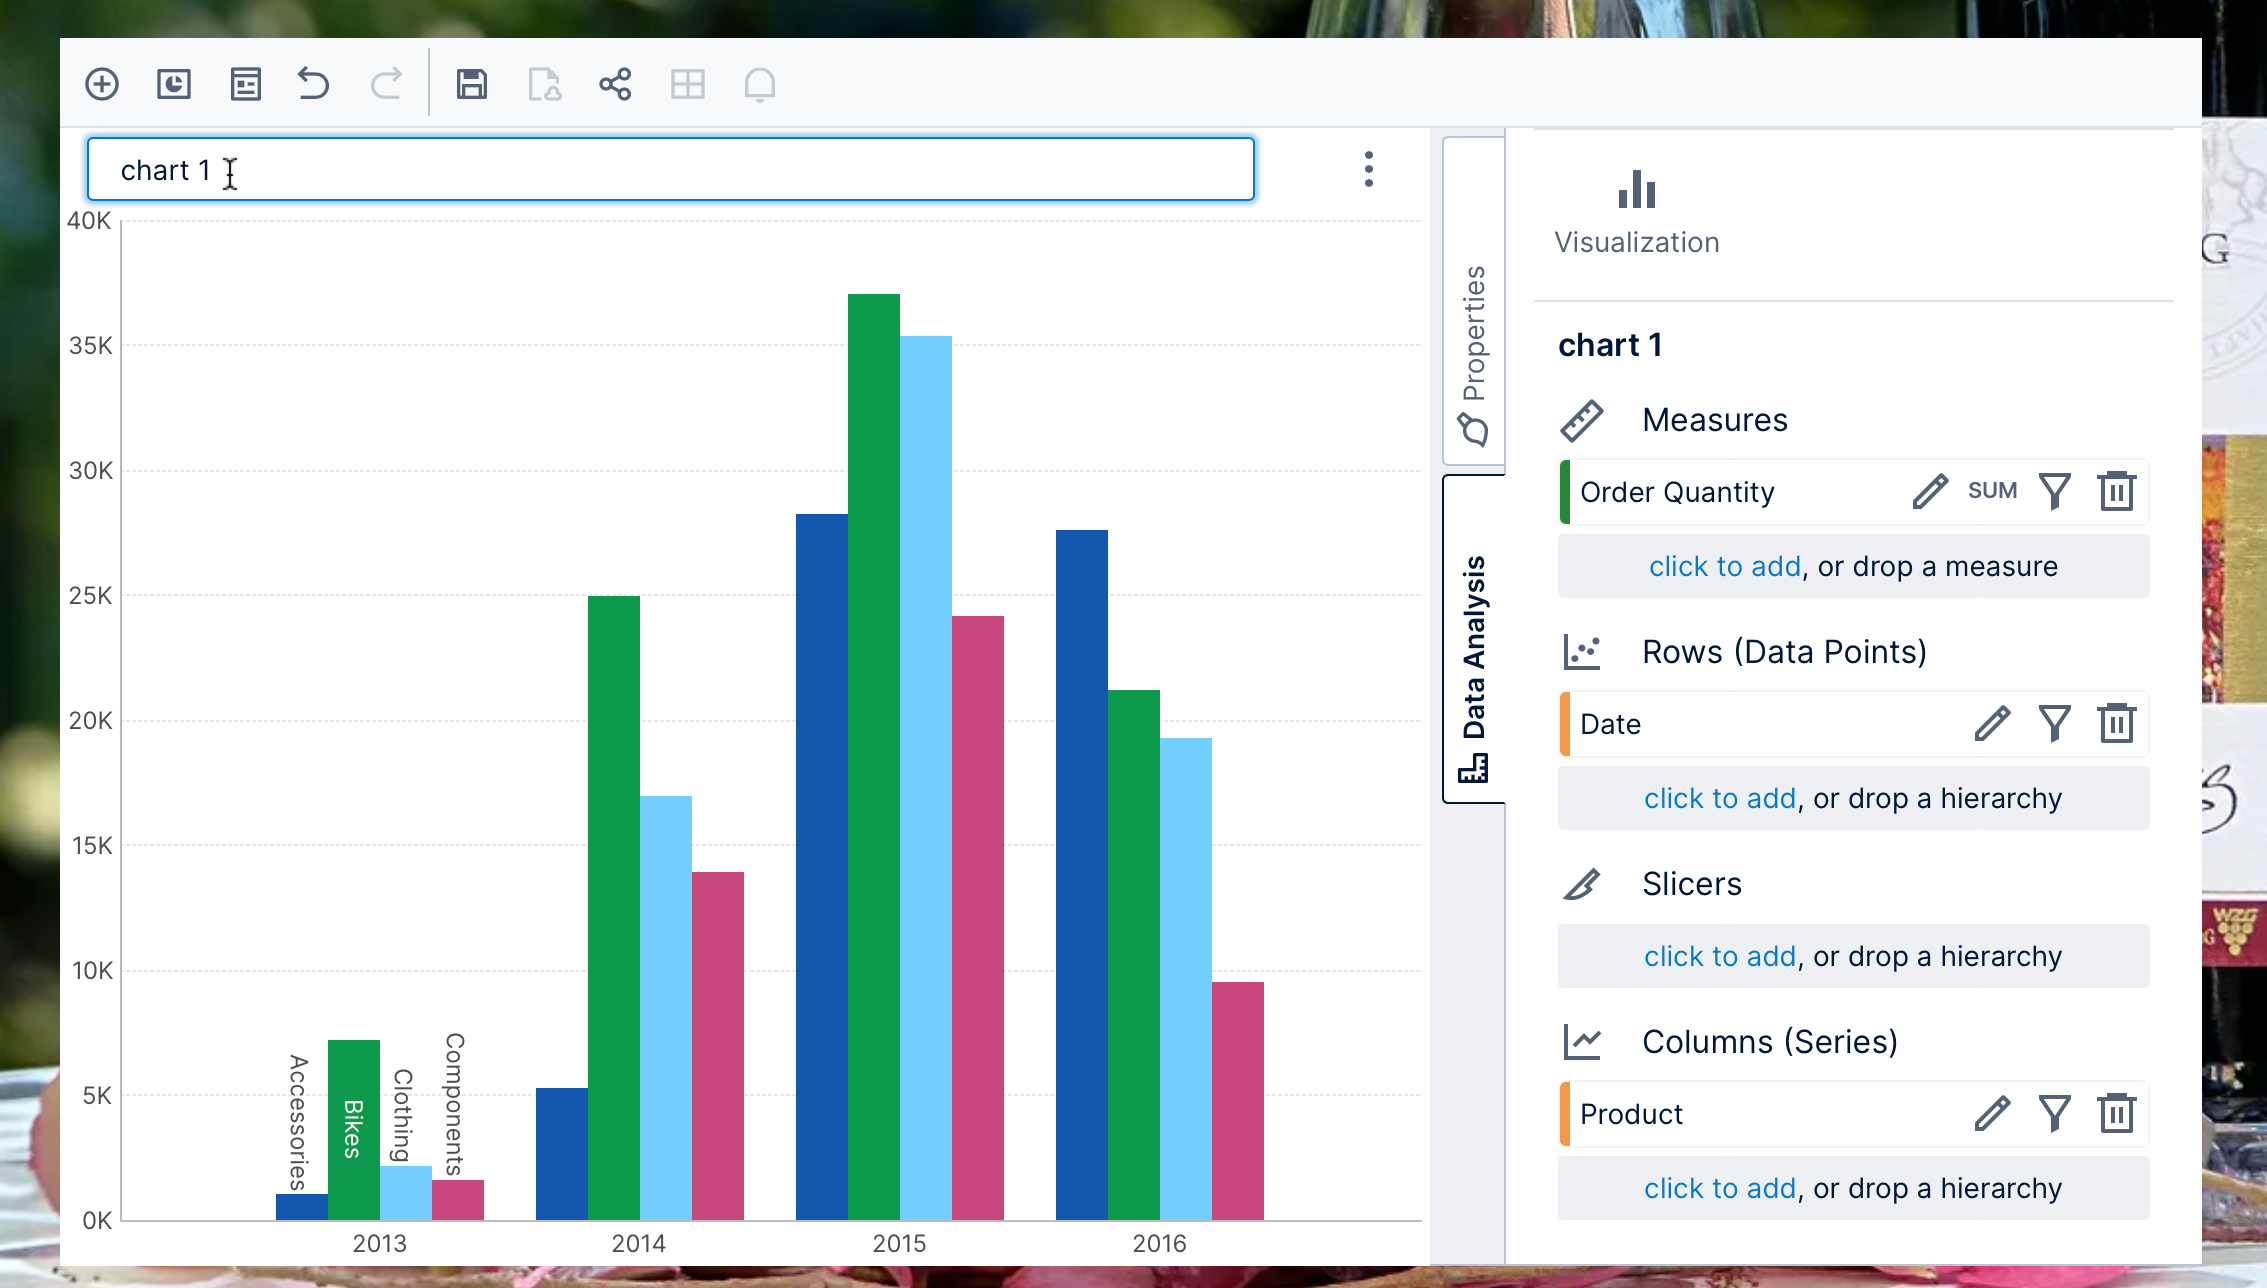
Metric sets are added to ad hoc dashboards as a copy so that users can make any desired changes to the data displayed, via the Data Analysis panel on the right. This is based on the full Data Analysis Panel provided for metric sets, allowing data to be added and removed, grouped, sorted, filtered, and more. Clicking on Visualization in this panel allows for changing the way data is visualized, such as by changing color for different values or displaying data in labels and tooltips.
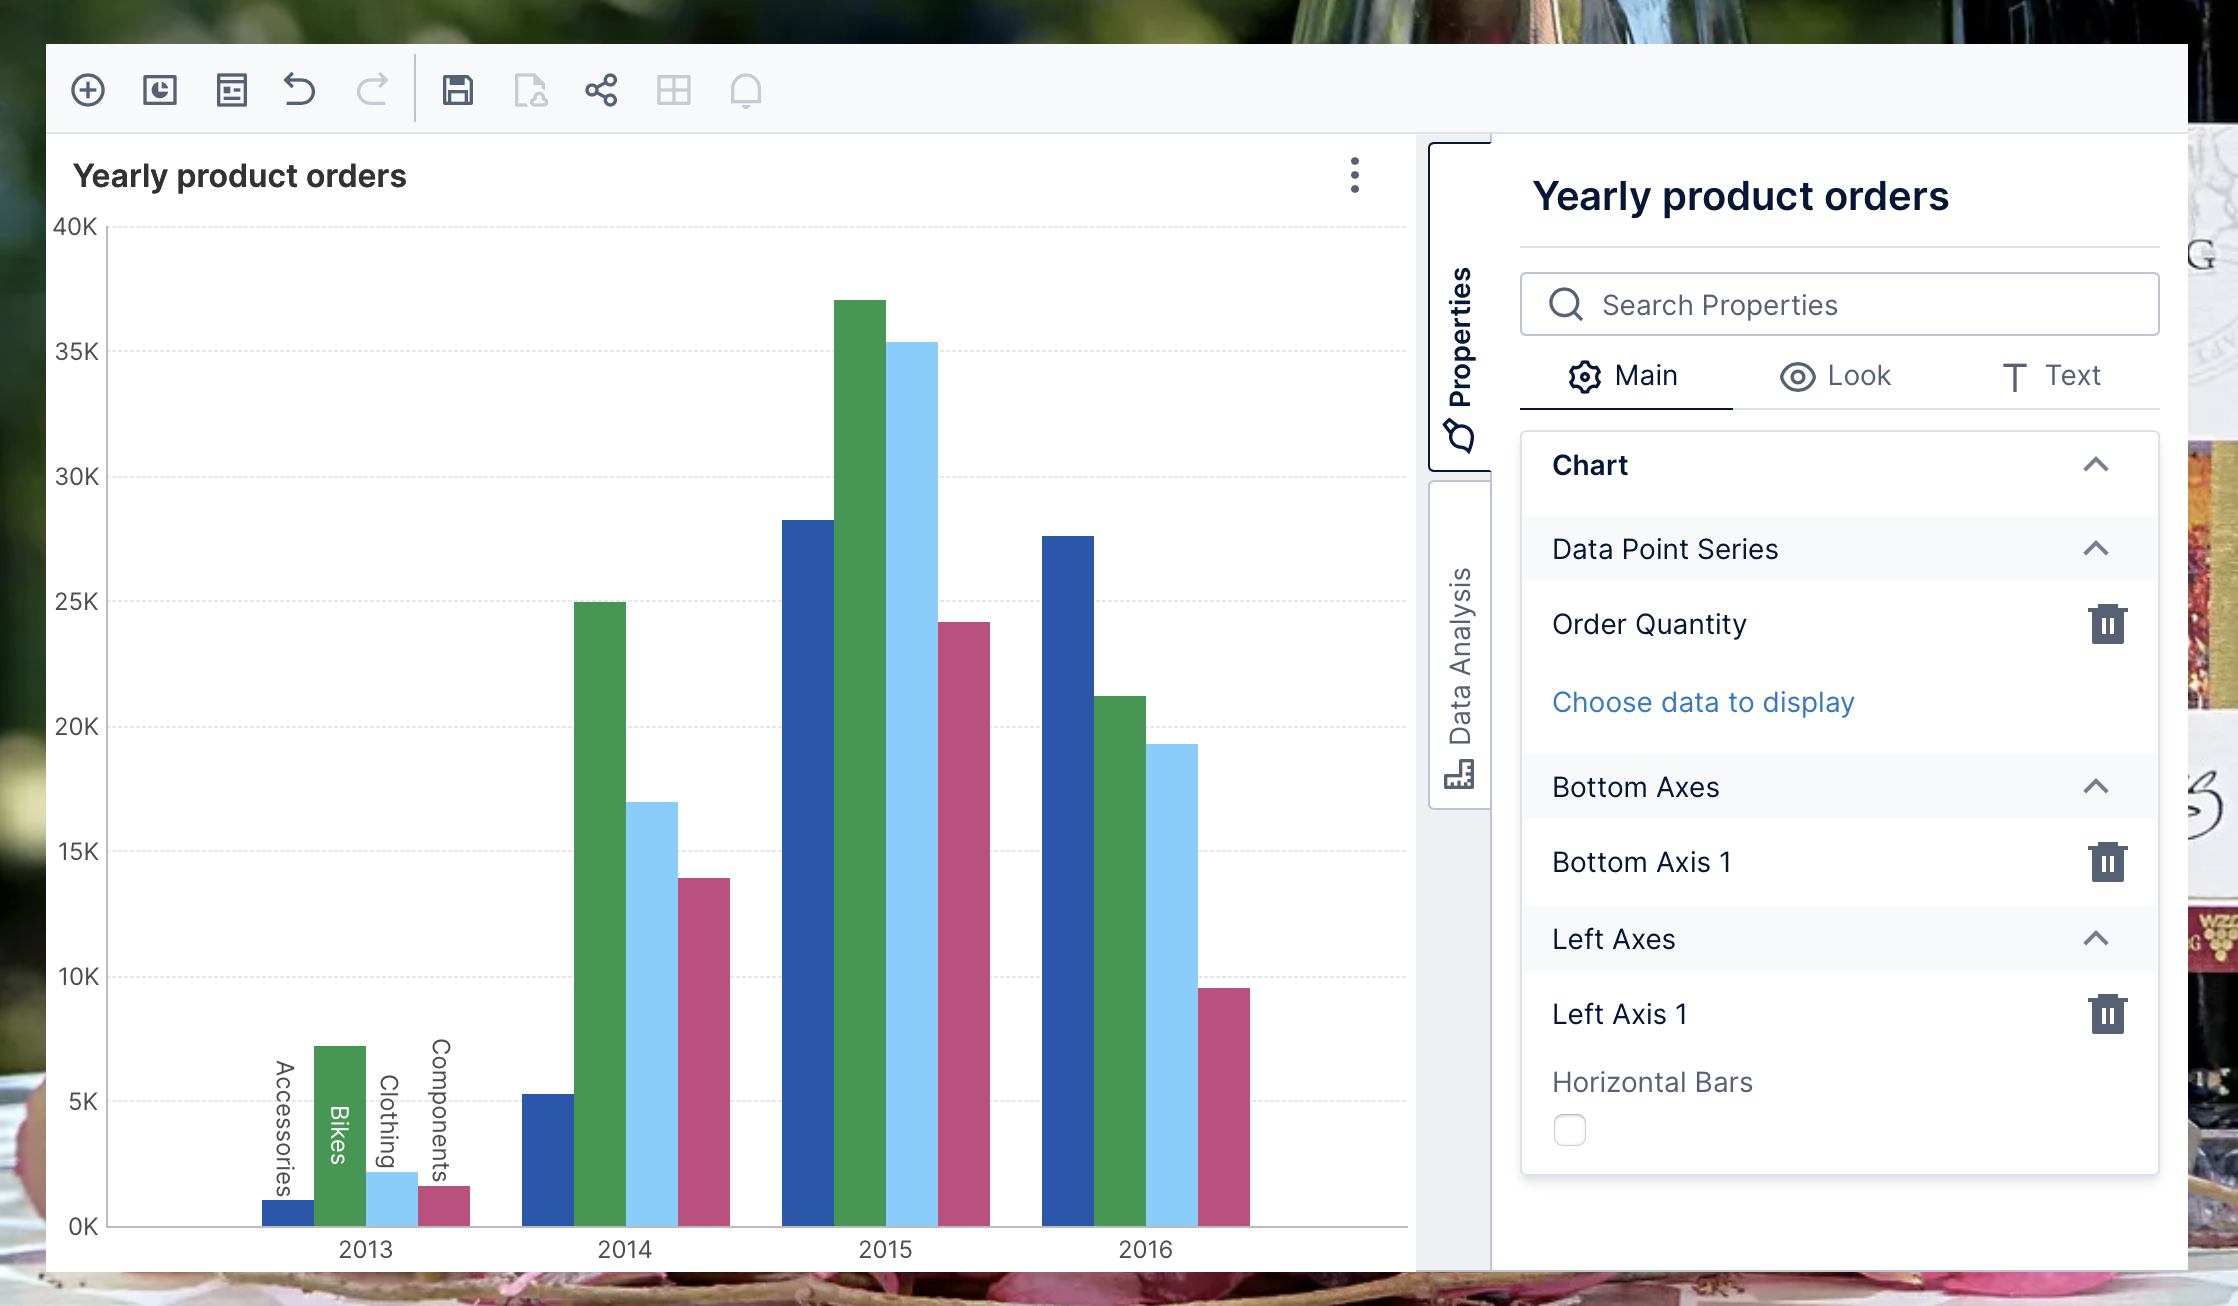
The panels on the right can be switched between like tabs, or clicked to expand or collapse them. The Properties panel provides a simplified subset of the property options provided when logging into the app directly, for styling and other customizations. For quicker access to specific parts of a visualization, users can right-click or long-tap them directly and choose a properties option such as Series Properties for a chart's data point series or Column Properties in a table.
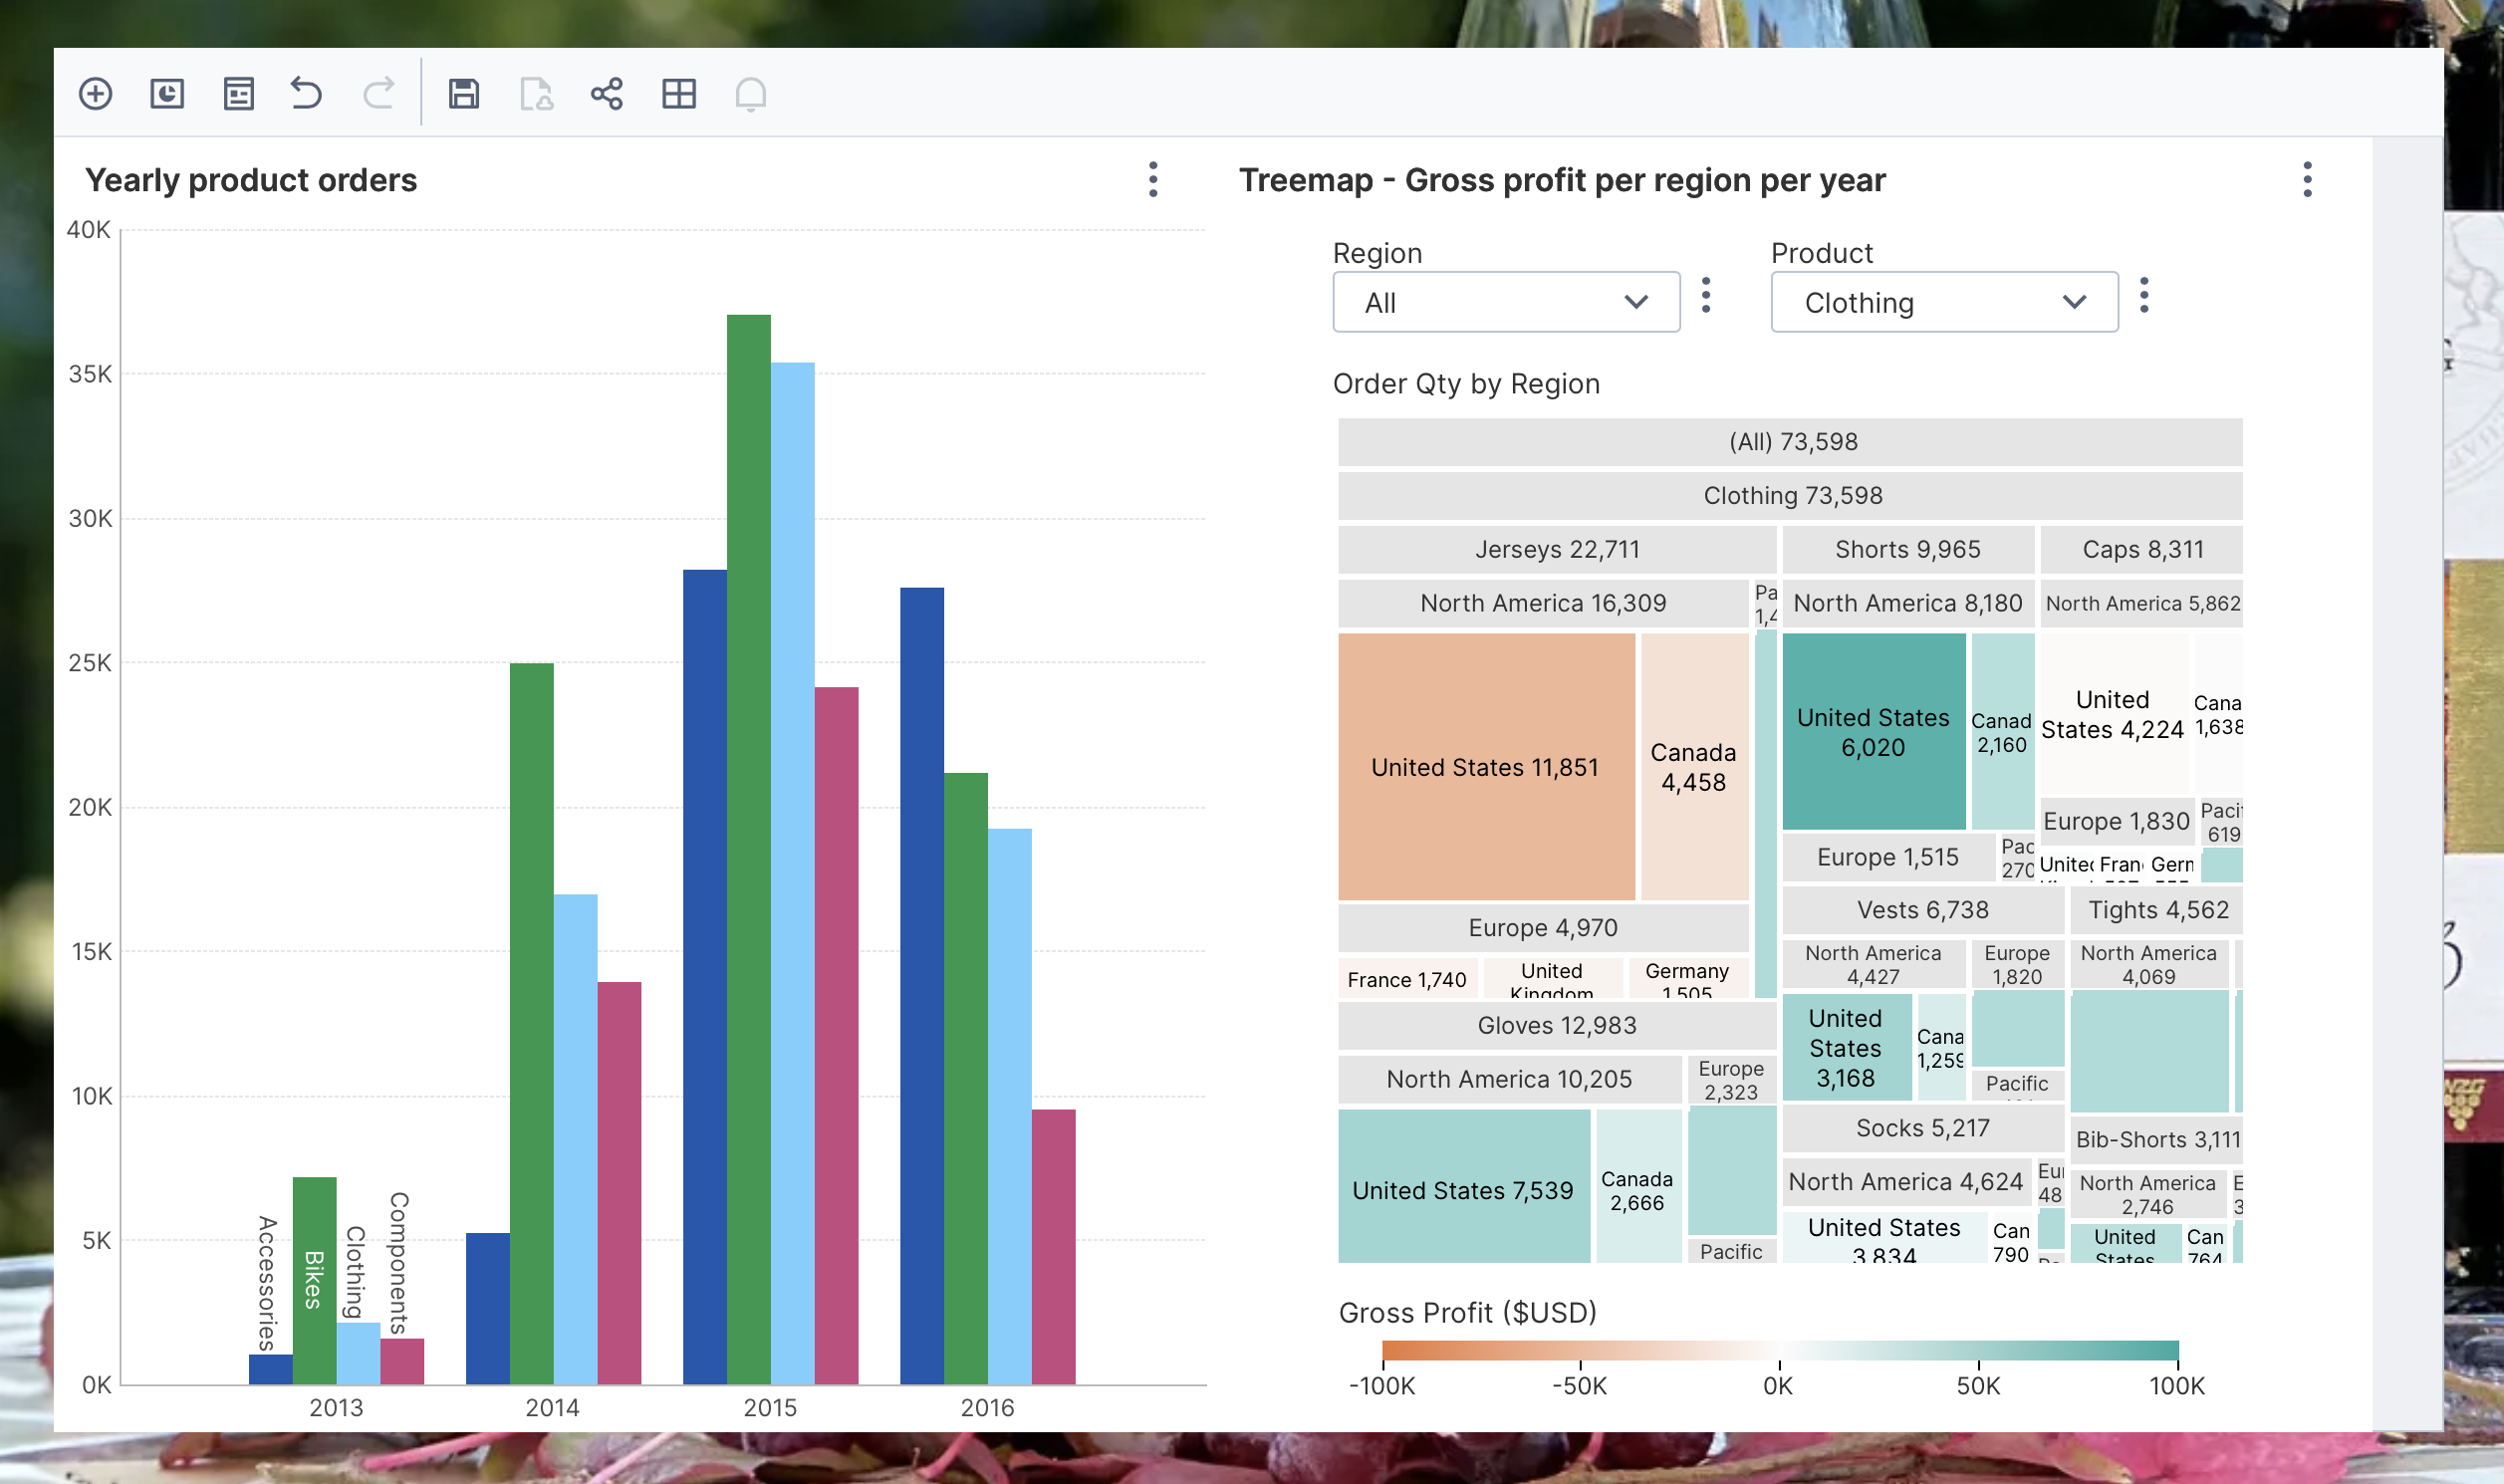
After adding multiple metric sets or other content items, the ad hoc dashboard's layout adjusts automatically to accommodate them but the user can adjust the sizing of rows and columns by clicking on the Grid icon in the toolbar. Users can click on a visualization to switch to it from another one when using the Properties or Data Analysis panels.
Existing full-featured dashboards and reports that were created directly in the app can be added from the toolbar the same way as metric sets, and their data can be interacted with, but settings and styling can't be changed.
5.2. Saving & publishing
Ad hoc dashboards are not saved automatically, instead users can click the Save button in the toolbar to choose a name and location within the project specified by the defaultProjectId option. If no project ID was specified, ad hoc dashboards will be saved and opened from each user's personal project or 'My Project'.
Once saved, users can can click to Publish the dashboard using the next toolbar button to allow others with access to the same project to view the changes. Users can publish the same dashboard again to save and share any changes made after that. This is like the check in option in the full application including saving the revision history. By default, only the user that created it is assigned file security privileges for modifying it, but other users can view it or save a copy, or the file privileges can be changed.
Using the Share button in the toolbar, users can share the ad hoc dashboard as an exported file such as an image, PDF, or Excel. The Notification button sets up a notification or alert to export and deliver content via email to selected users/addresses or via other enabled delivery providers.
Ad hoc dashboards are saved in the applicable project like a regular dashboard file, and can be accessed and managed by users logged into the full application with sufficient access rights or as an administrator. While they cannot be created or edited directly in this mode, they can be opened for viewing, and you can use the Save As option in the toolbar to convert it to a full dashboard to edit it.
6. More embedding methods
The entire application or any desired page from it can also be embedded via an iframe, or a WebView or similar component in mobile or desktop apps, or by simply linking to a Dundas BI or Symphony URL.
- In a web page or web application, the embed library can make this process easier, including helper methods facilitating any needed communication between your application's JavaScript and the embedded application.
- Alternatively, create an iframe element or WebView component yourself if desired, and load a URL including optional parameter values. You can still communicate with an embedded application using script as shown in the article on cross-origin resource sharing.
You may also need to communicate with a server from your application instead of or in addition to embedding it on the page. You can do this within a web application by embedding the JavaScript API directly onto your page as shown earlier, or you can also use the REST API directly from all types of applications. The .NET API is available to use from .NET-based applications.
You can make the interface match your own branding using white labeling support including custom CSS, JavaScript, HTML, and interface text, with support also for separate branding per tenant. You can plug in any custom functionality you might need via extensions anywhere from data providers, transforms, formulas, and visualizations through to export and notification delivery providers.
Besides logging your users in with one-time tokens, other single sign-on options are available including federated authentication with another identity provider you may already be using such as Azure Active Directory or Okta, or another provider using standard protocols such as SAML 2.0 and OpenID Connect (OIDC).
7. Notes
There are technical notes that can apply in specific cases when embedding included in the product notes, in the Browser and General sections.
The following apply when embedding on your page without an iframe as described above:
- Only one ad hoc dashboard editor can be embedded on a page, but the embedView and embedMetricSet methods can be called multiple times per page.
- Only one user session is supported at a time within a single open page in a browser.
- As this is an experimental API, there may be breaking changes in a future version if needed based on feedback and for added enhancements.