
1. Overview
When designing a complex dashboard, report, or other view, it can be important to keep performance concerns in mind. Simple steps taken during the design phase can dramatically improve performance and reduce the overall time to completion. A well-designed view will not only run smoothly for end users, but will also minimize server load. This article provides a set of guidelines and tips for optimizing performance.
2. Data storage
You can reduce querying times in some cases by using data cube storage options, such as when accessing a data source is slow or when running expensive transformations. Note that if you are displaying "live" or real-time data, you should not use data cube storage.
There are two types of optional data cube storage:
- Warehouse - stores data in a database
- In-memory - stores data in server memory
Using one of these options, your data cubes query their data sources once or on a schedule of your choosing. The result is stored with the data cube, and any requests for the data cube's data then comes from it directly rather than from the original data source. This option is particularly useful for data cubes that need to use expensive queries (for example, with many large joins). For more information, see Data cube storage types.
You can check the performance measurements if you want to determine how long it took a query to complete, or if it's retrieving data from your original data source or from the warehouse.
3. Data management
3.1. Remove unused columns
When creating your data cube, de-select the columns that you do not need as early as possible, such as in your Select transform configuration. 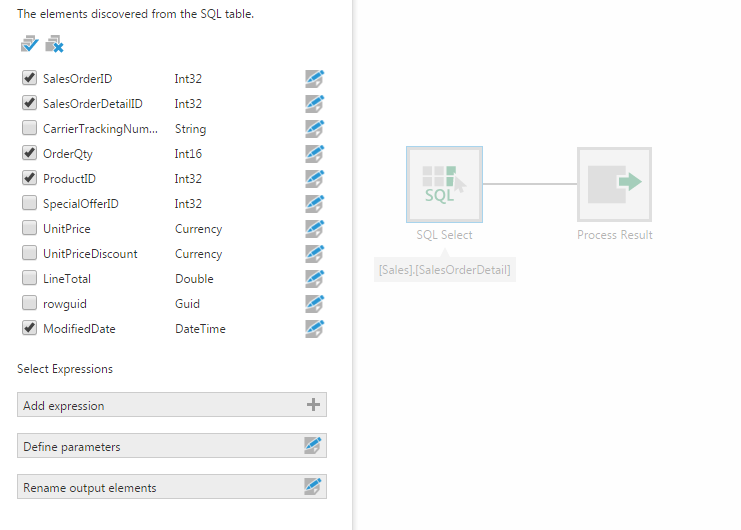
3.2. Note in-memory transforms
When possible, the transforms you add to your data cubes are incorporated into the queries sent to the data providers, so that transformations take advantage of the capabilities of your database or other data source and avoid transferring more data into the application than is needed.
Some transforms cannot be performed by the data provider, sometimes depending on their current settings, so the data is loaded into memory on the application server to perform the transformation. This is indicated by a small exclamation mark icon on the transform and the transforms that follow it.
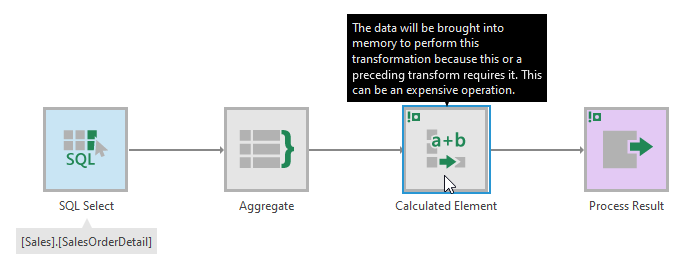
These transforms may noticeably impact performance for large amounts of data. If you want to improve performance, consider:
- Can the in-memory transformation be performed later in the data cube process, after transforms that can be performed by the data provider, by moving it closer to the Process Result at the end?
- Is all of the raw data output by the transform before the in-memory transform needed (view by selecting it and opening Data Preview), or can it be filtered or aggregated first?
- Can the data provider perform the calculation or transformation instead? For example, when you configure a SQL Select transform, you can add an expression to evaluate in SQL, or edit a column and access options such as date trimming, which will be executed by the data provider.
3.3. Aggregate early
If the granularity of your raw data is higher than the data you intend to display, aggregate it to the smallest granularity you need. For example, you may have data down to the second but only intend to show data by day, month, and year. You could trim and then group by or aggregate the raw data into daily data in this case. This can reduce thousands of rows of data into a single row.
When using the Distinct Count aggregator with large datasets containing many distinct values (e.g., millions of distinct values being counted), it may be necessary to query for each of the distinct values themselves if required for metric set analysis features such as totals (you can disable totals if not needed). If you find that performance should be improved in your case, it is possible to aggregate the data within the data cube instead and calculate the distinct counts you want to display there rather than using the Distinct Count aggregator of the metric set.
3.4. Filter early
Filter data as early as possible. For example, if you only ever visualize data for a certain time range, a specific set of regions, etc., using the Filter transform as early as possible in the data cube can help performance, since it may avoid unnecessary and costly joins.
3.5. Location of data, server, and client
Try to keep your data sources, the application server, and the client browsers as close to each other as possible. Network latency can have a major impact on performance if the data you need is on the opposite side of the planet. Warehouse and in-memory storage can help reduce this impact.
4. Developing dashboards and views
4.1. Simplify
More data visualizations are not always better. Each needs time to query data and to render, so find the right balance between the number of data visualizations and loading times.
4.2. Limit the initial amount of data
Consider using an initial filter setting other than All, especially if there's a lot of data involved, or displaying the top 10.
More data points make each phase of loading take longer. For large datasets, grouping and aggregating into fewer rows/points and columns/series may also help with readability.