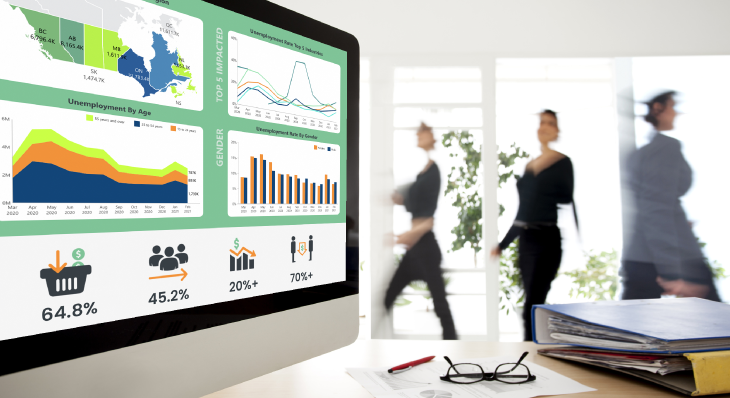
For years companies have been using data to identify trends, uncover insights and gain competitive advantage. But these days, government, healthcare and other public-sector organizations are seeing the value of self-service analytics, allowing the general public to interact with data through public-facing dashboards.
Typically they make this data available to the public in spreadsheets or PDF reports, so it’s difficult to dig deeper into the data. Plus, it’s often outdated unless someone on the back end is constantly updating it—a time-consuming and tedious task. And, if someone is trying to access that data over a mobile devices with a small screen, the user experience isn’t engaging and typically leads to low engagement.
An interactive dashboard, on the other hand, highlights trends and patterns in a simple, user-friendly way. At the start of the pandemic, we saw the rise of the ‘pandemic dashboard,’ which provided up-to-date data on COVID-19. For example, Dundas Data created a COVID-19 interactive dashboard that helped Canadians explore critical cases by geography and easily see hospital bed capacity in their region based on the critical care rate, as well as the ventilator count by province.
The ability for the general public to access self-service analytics through interactive dashboards can help organizations communicate with the public, engage with stakeholders and improve decision-making. Two use cases where we can expect to see public-facing dashboards have a positive impact on the lives of citizens is within the government and healthcare sectors.
Government: Building trust through transparency
The popularity of pandemic dashboards is helping to make the case for more public-facing dashboards in government. This comes at a time when we’re seeing the rise of smart, connected cities and when citizens are demanding more transparency from all levels of government as part of a broader movement toward open government.
“Data science is an essential area for governments, as they collect a lot of data in various areas (geographical, traffic, social security, energy, etc.) that can be combined or enriched with data from smart devices and other sources such as discussion forums, social media and private sector data,” according to a research paper in Government Information Quarterly. “The making of sound decisions depends on the use of high-quality data.”
Public-facing dashboards can help government officials communicate with the public and build trust through openness and transparency, which in turn can support decision-making and policy processes. For example, citizens can see how their government is progressing against a certain goal or target. Governments could also develop dashboards “for their own decision-making based on the input from citizen-engagement,” according to the research paper. But, to be successful, the dashboard requires high-quality data and must be updated on a regular basis.
Healthcare: Improving the patient experience
In a healthcare setting, public-facing dashboards can provide vital information to patients and the general public, helping to inform decisions and even influence behaviour—which we saw during the pandemic. The COVID-19 dashboard from Johns Hopkins University, for example, “is a resource to help advance the understanding of the virus, inform the public, and brief policymakers in order to guide a response, improve care, and save lives,” according to the website.
Public-facing dashboards can also be used to improve the patient experience, while educating the public at large. The Norwegian Directorate of Health, for example, used the Dundas BI platform to build visual reports, mostly in the form of interactive dashboards embedded directly into its public portal. By replacing static PDF files and reports, citizens can now interact with data in a self-service manner.
This, in turn, allows the Directorate to better visualize benchmarks and variation to find areas that receive different service levels than the norm. While citizens have access to data, healthcare providers can use the same data (in internal-facing dashboards) to streamline hospital operations, improve bed use and cut down on unnecessary readmissions—and, ultimately, improve patient care.
Benefits and challenges of public-facing dashboards
It’s easy to see the benefits of interactive dashboards—after all, would you rather interact with a dynamic dashboard or read a 50-page PDF report? And how accurate is that 50-page report when the numbers change? With the latest analytic tools, governments and healthcare providers can decide which data and dashboards to make public and which to use internally, so they have the best of both worlds.
But it’s important to get it right. The previously cited research paper found that challenges in developing public-facing dashboards include insufficient data quality, confusion about outcomes and imposing a pre-defined view (to name a few). This can lead to misconceptions and bad decision-making, so dashboards should be “complemented by mechanisms supporting citizens’ engagement, data interpretation, governance and institutional arrangements.”
If done right, public dashboards can be a valuable tool, providing visibility, transparency and accountability in government programs and healthcare operations. The right tools can help organizations quickly build and deploy custom, interactive dashboards—embedded directly in their public website—that can help to engage users and, ultimately, build trust.
About the Author

Vawn Himmelsbach is a writer and editor specializing in enterprise IT, writing for national newspapers and technology trade magazines on everything from AI to zero-day threats. She also spent three years working abroad as an Asian correspondent, covering all things tech.
Follow on Linkedin


Follow Us
Support