At Dundas Data Visualization, everything we do is driven by our passion for creating innovative software to help businesses solve real business problems. It’s with this mentality, that we continually strive to provide solutions that help businesses transform their data into actionable information so they can improve corporate performance and become more data-driven.
With our latest release, Dundas BI 4, data consumers, business analysts and BI professionals get greater control of their data and the freedom to work without depending on others.
With over 100 new features, Dundas BI 4 delivers unparalleled control with analytics that deliver the right data to drive the right decisions.
Our new release includes real-time user feedback to help you go beyond your existing data, new optimal visuals to help discover more insights, faster deployment at the enterprise level, extended integration and so much more!
Real-time User Feedback to go Beyond Your Existing Data
As a data consumer, you know your business best. Which is why we’ve added the ability to better enrich your data and record business input in real-time. This mix of simple and advanced options will further ensure everyone in your organization is data-driven with the most accurate, up-to-date information.
New in Dundas BI 4:
- Instant what-if analysis to better simulate the impact of data changes on overall patterns
- Centralize data collection processes via write-back to avoid data silos
- Ensure everyone is working with the right data, by correcting wrong or missing data on-the-fly
Insights through Optimal Visuals
As a business analyst searching for answers, you’re constantly exploring data. As such, we are continuously striving to provide new, innovative methods for visualizing your data. Dundas BI 4 is designed to help you spot insights much quicker with the aid of automatic visualization recommendations, smarter visualizations and extreme customization.
New in Dundas BI 4:
- Discover more insights with visualizations that are dynamically set and recommended based on your selections
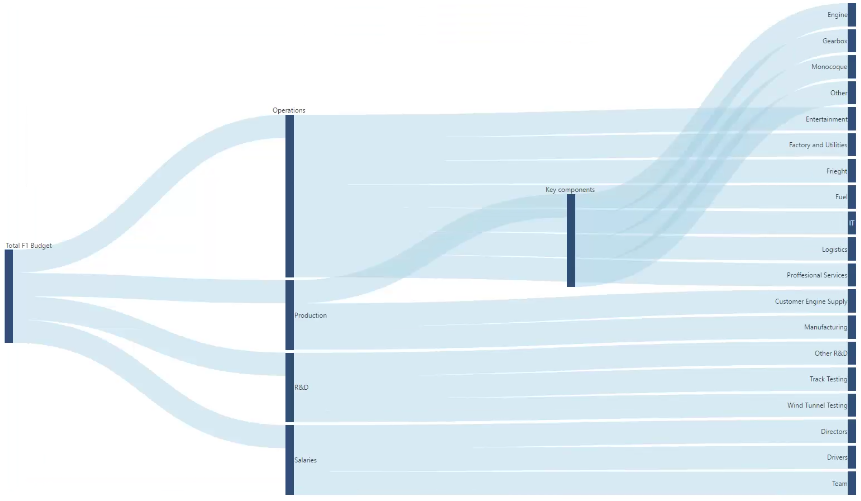
- Visualize distribution and loss of value with Sankey Diagrams
- Visualize the latest status of workflow processes with Custom SVG Diagrams
Faster Development at the Enterprise Level
As a BI professional, rapid development is the key to your success. We know this, which is why Dundas BI 4 allows you to capitalize on rapid prototypes and other business users’ work. We’ve made sure you’re able to successfully adjust to the ever-changing needs of your business, and can create the data analysis you require to act more proactively.
New in Dundas BI 4:
- With improved operation reports design, you can easily develop more complex, operational multi-page reports
- Replace existing metric sets and their dependent visuals with newly modified data models with ease
- Standardize rapid prototyping work with simple re-alignment to enterprise level data sources
Extended Integration – Inside and Outside
In addition to our existing capabilities for integration, with more connectivity, delivery and embeddability options, Dundas BI 4 simplifies how you integrate analytics within every business process.
New in Dundas BI 4:
- New Big Data connectors to natively connect with analytical databases
- Embed analytics faster than ever before with an updated JavaScript library
- Experience a better mobile experience with greater control
Request a personal, live demo of Dundas BI 4
Click here for a complete list of new features and enhancements in Dundas BI 4


Follow Us
Support