UPDATE - With the release of Dundas BI 6 (November 13, 2018), you're now able to calculate the distance between two locations using a built-in formula. For more details on how to use this formula, please see: Using a Distance Formula
Have you ever wondered how far away a customer is located from you, and how fast you can reach them? If you’re in certain industries, such as logistics, where timely delivery of products is critical to stay ahead of the competition, this information becomes highly valuable. Dundas BI allows you to retrieve these insights by looking at the address of the customer from your database, such as the CRM system, and calculates and displays the distance and travel time to get there on a dashboard.
Let’s say a client calls you for product delivery. You check Dundas BI and navigate to your dashboard that gets data from the CRM to visualize key metrics related to the client including the account information, and check their account history along with the delivery address. Based on the address, you call one warehouse and arrange for the product to be delivered to the client. However, to be competitive, you want to make sure that the warehouse you call is the closest to the client to ensure a quick delivery. Now, this is one piece of information that is missing from your existing systems. Where do you get this information from? One option would be to use the latitude and longitude coordinates of the 2 locations and calculate the distance using the Great Circle Distance formula by creating a formula within Dundas BI and leveraging the formula engine access to math expression.
If you’re like me, and prefer not to spend your time reading and understanding the logic of the great circle distance, you can simple copy the following formula and replace the placeholders to reflect your source and destination latitude and longitude:
3959 * Math.Acos(Math.Sin(Math.PI/180*($Lat$)) * Math.Sin(Math.PI/180*($Lat2$)) + Math.Cos(Math.PI/180*($Lat$)) * Math.Cos(Math.PI/180*($Lat2$)) * Math.Cos(Math.PI/180*($Long$) - Math.PI / 180*($Long2$)))
NOTE: To calculate miles, use 3959 as the first number. For kilometers, use 6371 as the first number.
However, this formula will only give you the aerial distance between the 2 locations. Often this distance isn’t accurate/realistic enough when it comes to actual travel time between those locations. To get a better sense of the actual travel time, you probably need to take into consideration the available roads and current traffic between those 2 locations. This is where you call an external web service such as the Google Distance Matrix API that looks at two addresses and calculates the distance between them based on Google’s recommended route and the time it takes to get from one to the other.
For more information on how to set this up in Dundas BI, please refer to this sample: http://www.dundas.com/support/developer/samples/extensions/use-a-custom-transform-to-call-a-web-service
You can use this service and join it with your CRM data to get a list of all the warehouses closest to the client’s location and select the one that is the nearest. Plotting this on a map will allow you to see the exact route that needs to be taken to get there.
For example, In Dundas BI you can set this up on a dashboard along with metrics coming from other systems:
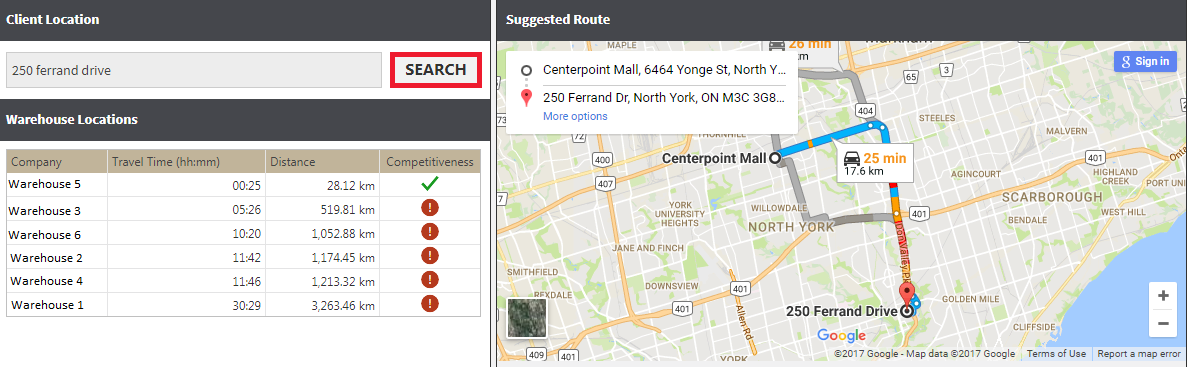
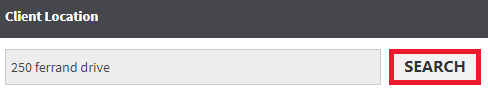
On this dashboard, to find out which warehouse is the closest to the client’s location, enter location into the search bar:
Get the list of warehouses closest to that location and display them on a table:
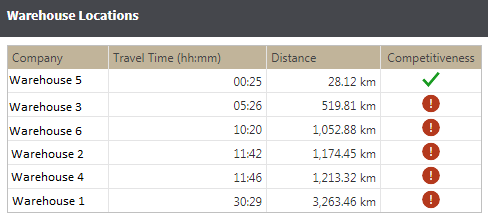
This table shows the distance from the 6 closest warehouses to the client’s location. The first row of the table will show the closest warehouse, with the remaining sorted in ascending order. It also displays the time it takes to travel from that location. These values are calculated by calling Google’s Distance Matrix API that returns the distance and travel time between two locations. These values were taken and combined with the data coming from the CRM within Dundas BI.
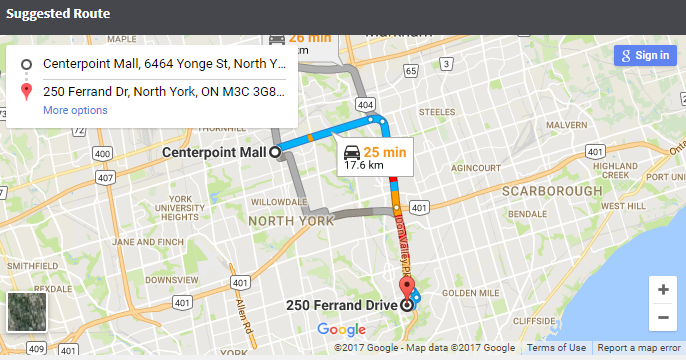
You can even integrate a Google map that plots the travel directions from the closest warehouse and suggests the route to take:
The above example is one of many use cases you can implement by calling external web services to augment your data. For example, a restaurant manager wants to know what the restaurant traffic is going to be for the week so that resources can be planned accordingly, but the traffic depends on the weather forecast for that particular day. This weather information can be obtained by calling one of the weather services available and combining it with the data available to the restaurant internally. This will help to not just predict the traffic for a specific period, but also forecast the sales for that period.
As you can see from the above examples, you can augment your data by taking advantage of the different web services and integrating those using Dundas BI with your existing data sources in order to get better insights in a single application.
Here are some other blogs we think you’d be interested in:
Follow Us
Support