In today’s hyper-competitive world, it’s becoming more and more important for businesses to react to events as soon as they occur, with little to no delay.
Whether it’s optimizing call center response times and quality of responses to improve customer satisfaction, detecting and preventing fraud at the point of sale, or targeting individuals with promotions as they enter physical or online stores, reacting to events as they occur helps businesses to make tactical decisions immediately and prevent any problems that may arise due to inadvertent delays.
It’s clear that all businesses want to be able to analyze data faster, but that doesn’t mean they all need to do so on real-time data. Many, if not most lines of business, will notice minimal difference if they were to analyze data using datasets that were updated within the last hour, or even overnight. Others will need to ensure their data is more up to date, but will have no problem with data that’s updated on a 5 or 15 minute schedule (near real-time data). In select cases, however, the ability to see the most up to date data is crucial. For example, if you are a call center operator trying to help a customer understand why he can no longer log into his customer portal you need to see his most recent transactions rather than have to wait for the next nightly update.
First Step: Connecting to Real-time Data
To be able to use real-time data, you must start by enabling a live connection to the data. This can take different forms and shapes depending on the use case at hand. In common cases, this could mean simply being able to send a query to an operational database that is collecting the data that’s entered into the system. For example, think of a customer relationship management (CRM) system where a support agent entered notes about the most recent discussion he had with a customer. When the support team manager wants to see all the discussions this customer’s had, she could simply open up a report that’s sending a query to that database directly, and showing the results.
While common, many analytics applications are struggling with this case as they are mostly optimized for advanced analytics and not for monitoring. That means that they are designed to support the ability to ask deeper questions about the data (i.e., are there any other customers that had similar discussions with our support team in the last 3 months?), but they are not optimized to do real-time data monitoring. To be able to support those kinds of analysis, those systems often pull the data in advance into their own data storage that is optimized for analytics (i.e., they use an in-memory data engine), but then you lose the real-time data connectivity as you must wait for the next refresh of the data in the system data storage.
The problem compounds when your data volume is large (i.e., think of the volumes of data behind a database that needs to collect call, SMS and other data usage transactions of mobile users of a certain telecom company). In those cases, there are popular big data databases or data structures such as Google BigQuery, Vertica, Amazon RedShift or Hadoop structures that can help with that data collection and often provide results for queries in a reasonable amount of time. In those cases, it becomes even more important to be able to lean back on the data source to provide the data in real-time rather than try and replicate it in another storage. In Dundas BI, there is an option to achieve the right balance between pulling data at real-time from the source, as well as storing it upfront in an optimized fashion for analysis by allowing the data modeler to choose his desired data storage for each data model.
Other use cases could be of streaming data that would come from a certain web service. This is a case most often seen in IOT scenarios and can be enabled in Dundas BI by connecting to the data directly via integrated Python or R scripts.
Second Step: Faster Reactions with Real-Time Data Monitoring Automation
The second step to empowering businesses to react more quickly to new data, is to enable real-time data monitoring. In other words – to automate the process of accessing data results as soon as that data becomes available (i.e., as soon as the data is collected/enters the system).
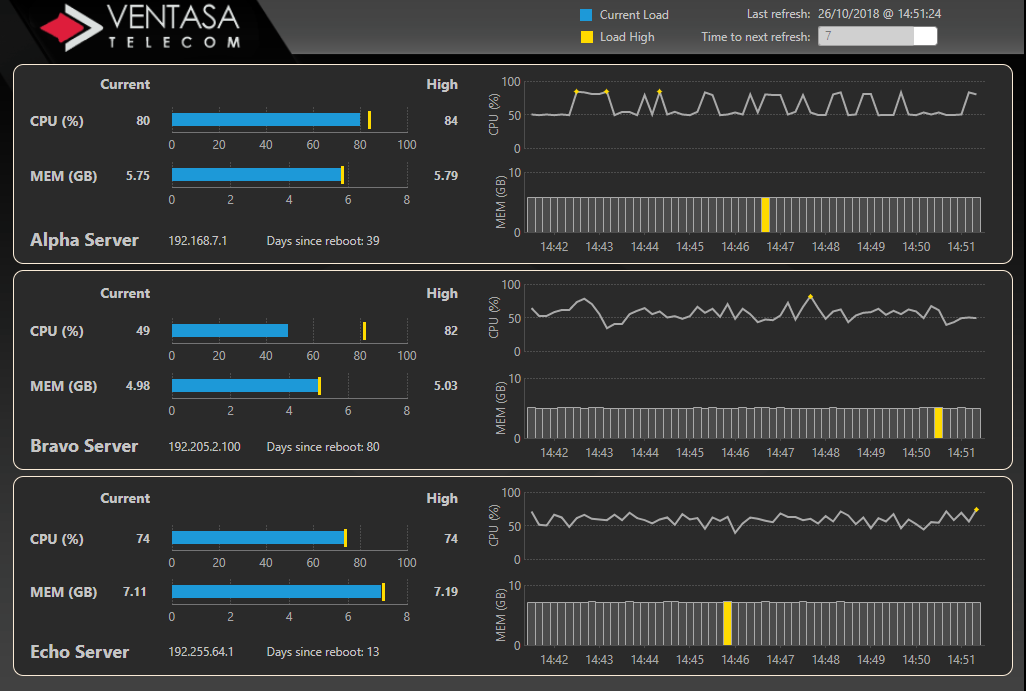
Take the following example: You are responsible for managing the IT infrastructure of a certain application. To do so, you need to ensure that your application servers are not exceeding their available CPU and memory resources. The basic setup for this task will be to setup automatic alerts to notify you whenever one of the servers is approaching a dangerous level. In Dundas BI, this is often done using data-driven notifications where anyone can define data conditions for when alerts should be delivered. But to easily understand what the actual status is of your servers, you would probably want to be able to see your data in a more visual manner. Like this, for example:
Click on the image to access the live dashboard
Figure 1: Call Center Dashboard Built in Dundas BI with Real-Time Data
Using this kind of dashboard, the owner of the application can quickly monitor the performance of all of his servers using the most recent data. The benefits of this kind of dashboard over the use of notifications alone are obvious: You can visually see the results of your data at any-time without having to wait for an alert notification. You will also notice that this dashboard is updating automatically every 10 seconds with the latest data. The updates are continuous (as opposed to having someone manually refresh the dashboard) and the charts are seamlessly adding the new data points relevant to the latest time window (as opposed to having the charts or entire dashboard render again, which would force the user to try and read it from scratch again). This is a popular setup, especially when you want to mount those dashboards on your office walls and have those visible to anyone in order to increase awareness.
It’s important to note, however, that these dashboards can help you with much more than just seeing the current results. With the right setup and tools, these can be your entry point into making better decisions and taking faster actions.
The Next Step: Faster Analysis with Real-Time Data Analytics
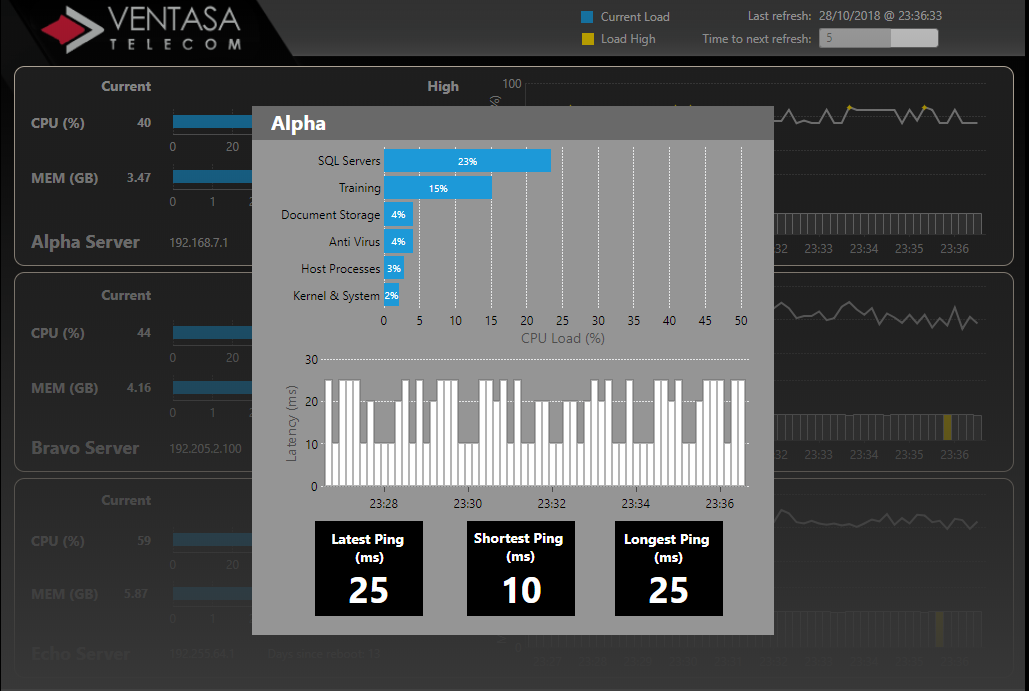
Taking real-time data monitoring into real-time analytics where users can perform analysis of data as soon as that data becomes available, is what can really give users insights that’ll empower them to react immediately to changing data. Using the same example from above, whoever’s using the dashboard can not only quickly identify the potential memory issues on the Alpha server, but can also drill down into that server’s performance and see the breakdown of the resources that are contributing to the CPU load – in this case, it’s readily apparent the issue is coming from the SQL Servers.
Figure 2: Real-Time Server Performance on a Dashboard Built in Dundas BI
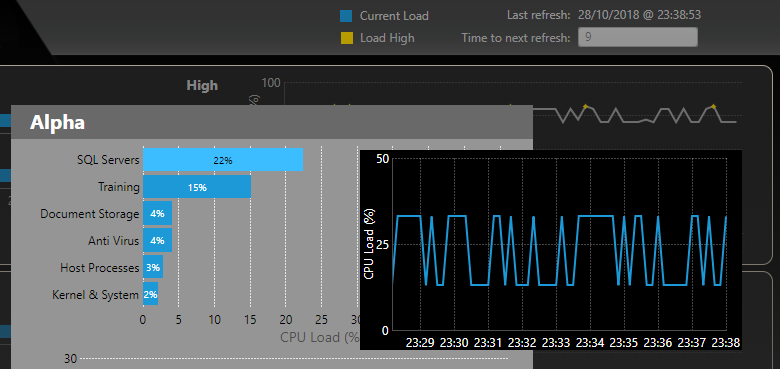
It’s then possible to hover over the different items and dive deeper in real-time into the most recent trend to determine if this is a new or expected behavior:

Figure 3: Drill-Down for Deeper Analysis in Real-Time in a Dashboard Built in Dundas BI
It is important to note that in this example, the drill-down path (at least the immediate one in order to troubleshoot the issue) is known in advance. In fact, the ideal scenario would be to get to a state where your entire process is automated, meaning not only the ability to analyze the data but also to automatically take a decision. For example, if I see that my server is about to reach full capacity, then there is an automatic process that will allow me to balance my load using other servers.
Unfortunately, full automation isn’t always possible. That is why being able to move into deeper analysis using self-service capabilities is key to fully enabling real-time analytics. Ideally, you would want the following abilities to make this process even faster:
- Answer new questions by starting from the dashboard where the question is raised rather than from a blank canvas. In other words, be able to see an issue on your dashboard and dive into the data behind it right from there.
- Use a data analytics engine that is able to not only retrieve data in real-time but also support your data exploration using on-the-fly data modeling. For example, the ability to analyze data across different levels (time, geo or any other categorical hierarchy) without having to prepare a data model in advance.
- The ability to contextualize your data on-the-fly. For example, by enriching your data and blending it with other sources, by adding additional calculations, by easily adding comparisons to previous periods, or even just by typing in your target values.
Giving the power of real-time analytics to your different users is what can really elevate the quality of your business' reactions by minimizing the time to better insights.


Follow Us
Support