Everybody has their own baggage when they start using a new software – specifically for BI and analytics software.
Some users have been around for quite some time and may be used to a legacy IT led applications such as SQL Server Reporting Services or Cognos. Others may be new to the space or are just advanced Excel users that are looking for better ways to interact with and share their data internally and externally. As a result, the expectation one may have when starting with new applications, varies quite a bit depending on their previous experience with other tools. In most cases it is easier to revert to our comfort zones and operate the way we have been for quite some time.
With this introduction in mind – here is my list of the 5 things I wish I’d known when I started using Dundas BI – I believe this list will resonate with many of you.
#1 – Getting started with Dundas BI’s built-in walkthrough
If you’re new to Dundas BI, but aren’t using the admin account (the admin account is the very first user that was defined during the installation), then it’s possible you’ve missed the Start Here dashboard that includes the Getting Started with Dundas BI project.
This dashboard provides a great interactive walk through of the application if you are entirely new to it. It’s particularly valuable if you are an analyst (power user) looking to analyze and share data, and create content.
Note – it doesn’t cover the data prep (data cube) layer but it still applies to all users even if they’re more advanced users.
In most cases, this project is pre-installed on the application, so to access the walkthrough, simply select the Getting Started with Dundas BI project and open the Start Here dashboard. If the project isn’t there, you can always add it to your instance. If you are the admin user – it may be a good idea to set this dashboard as the default view for new developers/power users.

#2 – No desktop application, therefore no need to publish to a server or service
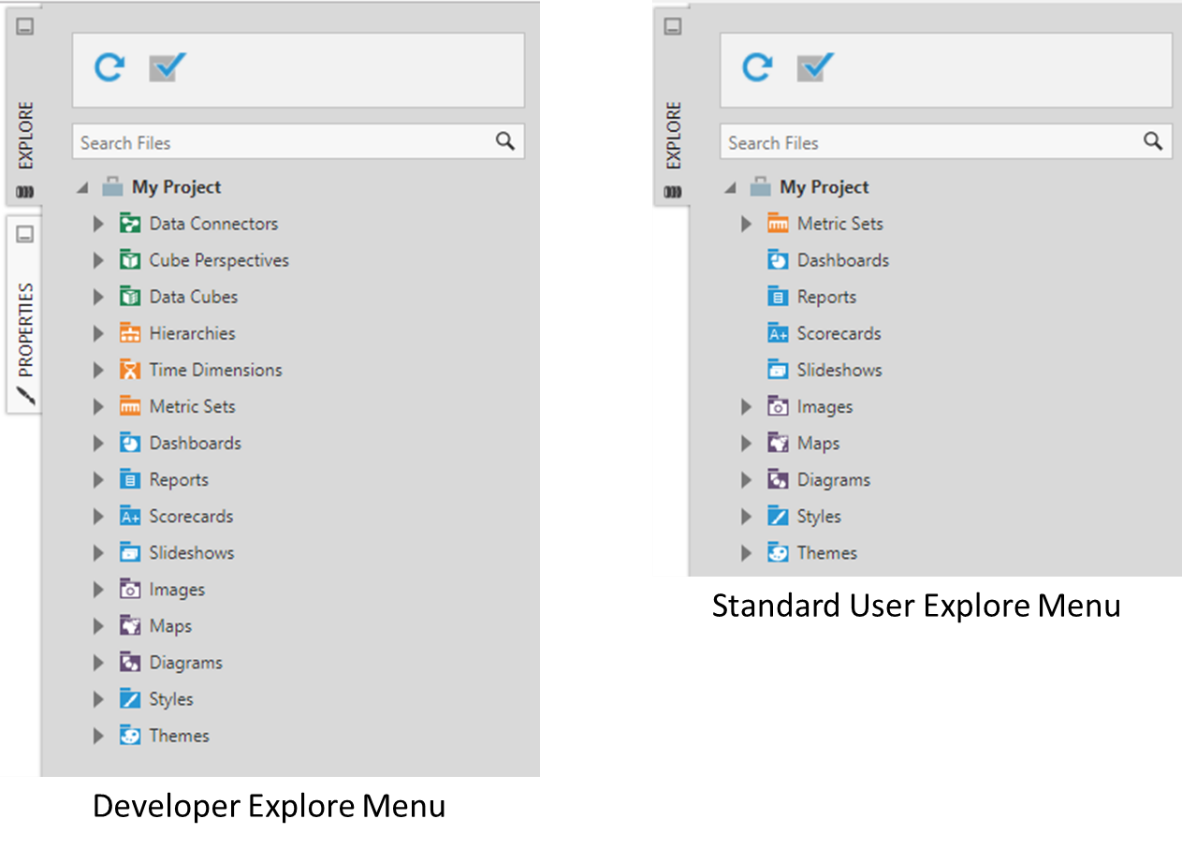
Unlike many other applications where there is a desktop application for content creators and a subsequent process required to publish to a server/service to share that content with consumers, Dundas BI is entirely web based across all user types. That means that once it’s installed on your local web server or cloud hosted infrastructure, any user, whether they are a developer, power user or standard user, will only need a browser that can run HTML5 (basically any browser) to access the application. Dundas BI automatically adapts the experience (i.e. set of options) to the type of user that’s logged on.
For example, if I’m a standard user that is logging on using the same Dundas BI URL that a developer user used, my Explore tab will show different options:

Since there is zero footprint for the users to get started (no installation) and since they are already working in the same instance (vs. on silo desktops), not only is the ease to adopt the system as well as share and collaborate, simpler, but also the ability to govern the usage by admin users, much greater. All of that is to say, that if you are looking to find how you share your work with others, all you need to do is check-in your object (i.e. dashboard). Then other users (if they have the permission) will be able to access your work (for example using the same URL you use).
#3 – Projects organizations – My Project and the Global project
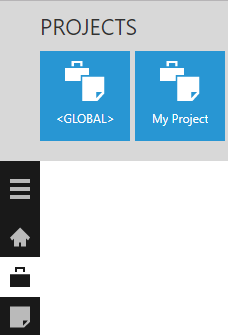
In order to enable different users to consume the data they need the way they need it, each user gets his own personal space named My Project. By default, this is each user’s active project when they log into the system and it is designed to allow the user to experiment and analyze data as needed without cluttering the system for others. That is why other users in the system will not have access to it (unless they are admin users) but they can still view items created within that project if the creator chooses to share them.
But how do you make sure content is re-usable so you don’t have to create the same data connections or data models under each user My Project?
That is where the Global project comes into play. It is good practice to create any item that should be reused by other users or within other projects under the Global project. Those objects (i.e. data connectors, data cubes, metric sets) are then easily accessible via other projects under the Shared folders. Thus, if you are the first user to log into Dundas BI within your organization and you want to create content that will be used by others vs. just play with your personal Excel file, it is recommend to first switch to the Global project and start your work in there. If you forget to do so or if you created some really good content in your personal project that should be reused (vs. just viewed) by others, than you can always use the publish option to move content between projects.

# 4 – There is no need to save your work – Dundas BI does it for you
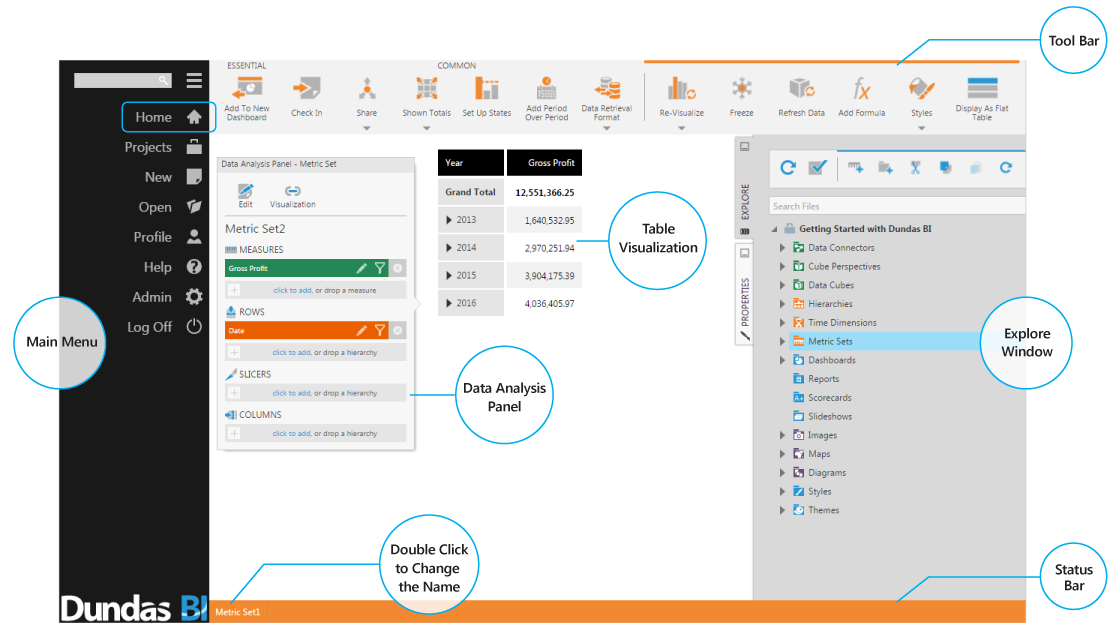
Where’s the Save button? There is no save button (at least not by default). This is another advantage of working with no desktop application – you don’t need to save your work as Dundas BI does it automatically for you. Similar to how Gmail or other services auto-save your work so you can always pick up where you left without having to worry about saving it, Dundas BI does exactly the same. And if you really want to be sure your work is saved – you can take a look at the status bar and you’ll notice a small message there indicating your work is saved.
#5 – Multiple work flows –work the way that best suits you
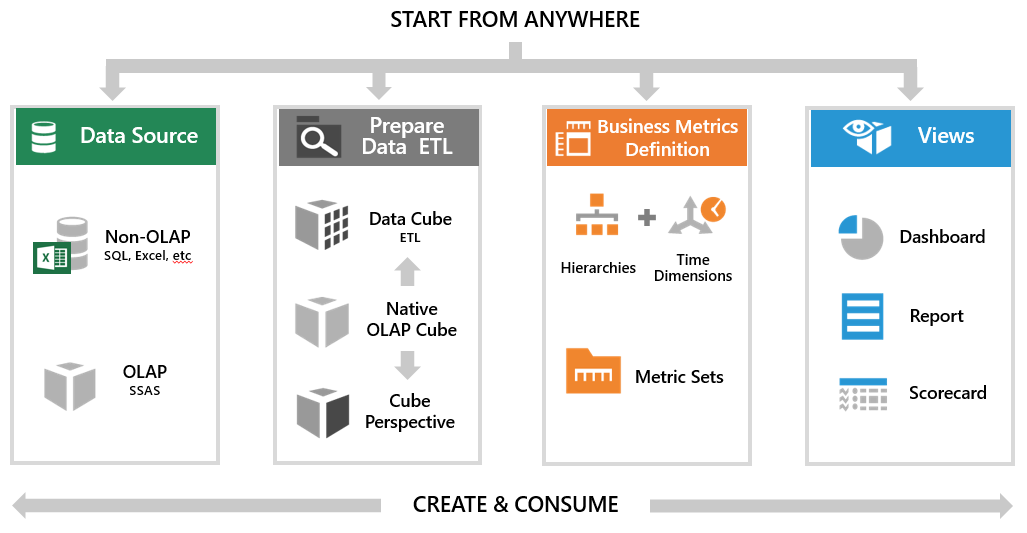
Dundas BI is built entirely on open API. That means that every component you see in the UI can be accessed via the API, which in other words means, it can be accessed from anywhere.
For example, if you want to connect to data, you can click on Connect to data and create a new data connector, but you can also just click on Explore data and define the connection right in there. You can even create a new dashboard and drag an Excel file directly onto the dashboard and that will automatically create the data connection for you.
The same goes for where you create your metrics – you can do so in a new metric set (Explore data) or you can do so directly on a dashboard. Then it becomes a question of what you are trying to do and how this flexibility allows you to work faster.
For example, if you just want to explore data and you are not sure it’s even going to land on a dashboard, then of course click on Explore data. However, if you are combining multiple visuals together on the same view, it may be faster to create a new metric directly on this dashboard rather than going back to the Explore data designer and then back to your dashboard to add it back in.
The coolest thing about those flexible work flows is that you can always work your way backwards.
For example, if you created a new metric set directly on a dashboard and you would like to now have this metric accessible by other users directly from the metric set folder – you can simply promote this metric set or the data cube behind the metric set.

I’m sure each one of you will make your own list on what you wish you’d known when you started using Dundas BI, and that is why this closing remark is perhaps the most important one:
Dundas BI is an end-to-end BI platform, and as such there is always lots of things you can learn that are impossible to learn at one go.
That is why the team at Dundas is dedicated to your success and offers different avenues to best learn the platform. Whether you like to learn at your own pace or take training classes, or learn from others, there are many options out there to get started.
Here is a good list for some of the resources:
Videos – Get started with our introductory Videos & Tutorials
Support Documentation –Valuable resources for becoming a Dundas BI expert
Dundas’ Support – Dundas amazing support team is here to help with any question
User Forums– Share ideas, ask questions and engage with the user community
Articles – Learn more about Dundas Data Visualization and BI & visualizations
Samples – View sample dashboards created using Dundas BI
White Papers, Market Studies and More – Read white papers and market studies from Dundas Data Visualization to learn more about BI and visualizations
Training –Create Dundas BI and visualization experts in your company with Dundas training and workshops
Blog – BI, Analytics and Data Visualization topics you need to read


Follow Us
Support